

Support test at $4.50: Can TLRY avoid deeper losses?

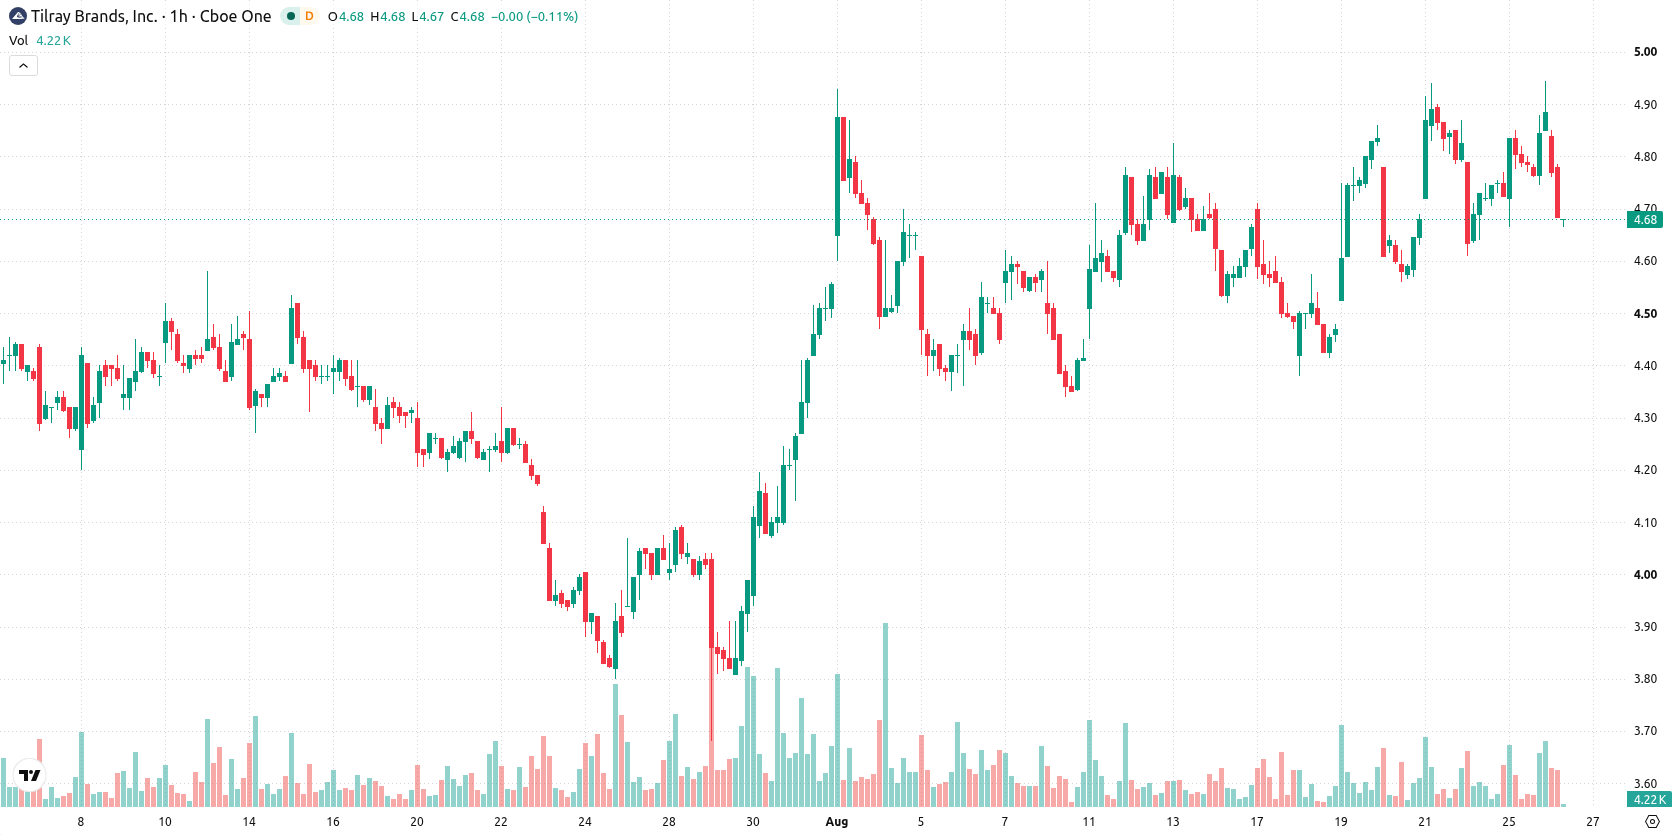
Tilray (TLRY) stock is trading at $4.68, down 4.1% on the day. The price is currently positioned below its key short-term moving averages, reflecting intraday pressure.
 2.67
2.80
Highlights
- Shares of TLRY closed at $4.68, declining 4.1% with high volatility and ending near the session low.
- The stock remains in a longer-term bearish trend, trading below critical moving averages and facing resistance at $4.75.
- Oscillators suggest overbought conditions with stretched intraday momentum, and price is expected to consolidate between $4.50 and $4.94 over the next four sessions.
Mixed momentum signals emerge as oscillators warn of overextension
TLRY currently trades below its MA-20 at $4.79 while remaining just above the MA-50 at $4.68 on the H1 timeframe. The price is significantly beneath the long-term MA-200, set at $6.93 on the daily chart, and faces immediate resistance from the Ichimoku Kijun at $4.75. MACD is signaling a buy, but ADX remains neutral, suggesting that while momentum has turned positive, a clear trend has yet to develop. RSI is elevated at 61.08 and also issues a buy signal, but Stoch RSI and CCI are both in overbought territory, indicating stretched intraday conditions. Bull/Bear Power points to buyer dominance in the short term, and the Awesome Oscillator confirms a buy, though divergence with other oscillators highlights potential overextension amid recent volatility.
Rangebound trade expected as consolidation caps bullish breakout
Looking ahead over the next four trading days, TLRY is expected to trade within a range of $4.50 to $4.94. The implied probability for an upward move stands at 57%, while a move lower is less likely at 43%. The baseline forecast calls for consolidation within this volatility band. A clear break above $4.75 would trigger a bullish scenario, while a downside scenario unfolds on a loss of support near $4.50.
Earlier, analysts noted that Tilray shares were caught in a range-bound pattern, with technical and regulatory factors contributing to a mixed outlook. The current analysis signals mounting short-term volatility and stretched intraday conditions, heightening the importance of the $4.75 resistance level as a potential pivot for near-term price direction.






Latest Tilray Brands News




-
 Afghanistan
-
 Albania
-
 Algeria
-
 Angola
-
 Argentina
-
 Armenia
-
 Australia
-
 Austria
-
 Azerbaijan
-
 Bahamas
-
 Bahrain
-
 Bangladesh
-
 Belarus
-
 Belgium
-
 Bolivia
-
 Botswana
-
 Brazil
-
 Brunei
-
 Bulgaria
-
 Cambodia
-
 Cameroon
-
 Canada
-
 Chile
-
 China
-
 Colombia
-
 Congo
-
 Costa Rica
-
 Cote d'Ivoire
-
 Croatia
-
 Cuba
-
 Cyprus
-
 Czechia
-
 DR Congo
-
 Denmark
-
 Dominican Republic
-
 Ecuador
-
 Egypt
-
 El Salvador
-
 Estonia
-
 Eswatini
-
 Ethiopia
-
 Finland
-
 France
-
 Georgia
-
 Germany
-
 Ghana
-
 Greece
-
 Haiti
-
 Hong Kong
-
 Hungary
-
 India
-
 Indonesia
-
 Iran, Islamic republic
-
 Iraq
-
 Ireland
-
 Israel
-
 Italy
-
 Jamaica
-
 Japan
-
 Jordan
-
 Kazakhstan
-
 Kenya
-
 Korea
-
 Kuwait
-
 Kyrgyzstan
-
 Laos
-
 Latvia
-
 Lebanon
-
 Lesotho
-
 Libya
-
 Lithuania
-
 Luxembourg
-
 Madagascar
-
 Malaysia
-
 Malta
-
 Mauritius
-
 Mexico
-
 Moldova
-
 Mongolia
-
 Montenegro
-
 Morocco
-
 Mozambique
-
 Myanmar
-
 Namibia
-
 Nepal
-
 Netherlands
-
 New Zealand
-
 Nigeria
-
 North Macedonia
-
 Norway
-
 Oman
-
 Pakistan
-
 Palestine
-
 Panama
-
 Papua New Guinea
-
 Paraguay
-
 Peru
-
 Philippines
-
 Poland
-
 Portugal
-
 Puerto Rico
-
 Qatar
-
 Reunion
-
 Romania
-
 Rwanda
-
 Saudi Arabia
-
 Serbia
-
 Singapore
-
 Slovakia
-
 Slovenia
-
 Somalia
-
 South Africa
-
 Spain
-
 Sri Lanka
-
 Sweden
-
 Switzerland
-
 Syria
-
 Taiwan
-
 Tajikistan
-
 Tanzania
-
 Thailand
-
 Trinidad and Tobago
-
 Tunisia
-
 Turkey
-
 UAE
-
 Uganda
-
 Ukraine
-
 United Kingdom
-
United States
-
 Uruguay
-
 Uzbekistan
-
 Venezuela
-
 Vietnam
-
 Yemen
-
 Zambia
-
 Zimbabwe
- Forex
- Crypto












