


Flex Ltd (FLEX) surged 3.34% on a sharp intraday rebound, with traders capitalizing on oversold technical readings and strong volatility. The upswing looks limited, as the stock remains below its 20-day and 50-day moving averages, signaling lingering near-term weakness despite long-term support.
 89.99
95.07
Highlights
- Flex stock trades below its 20-day and 50-day moving averages but remains well above the 200-day level, showing long-term strength despite near-term softness.
- Multiple technical indicators, including MACD, RSI, and Commodity Channel Index, are in negative or oversold territory, with sellers dominating intraday momentum.
- Over the next five trading days, the expected price range is $111.6 to $120.33, with a 65% probability of a downward move.
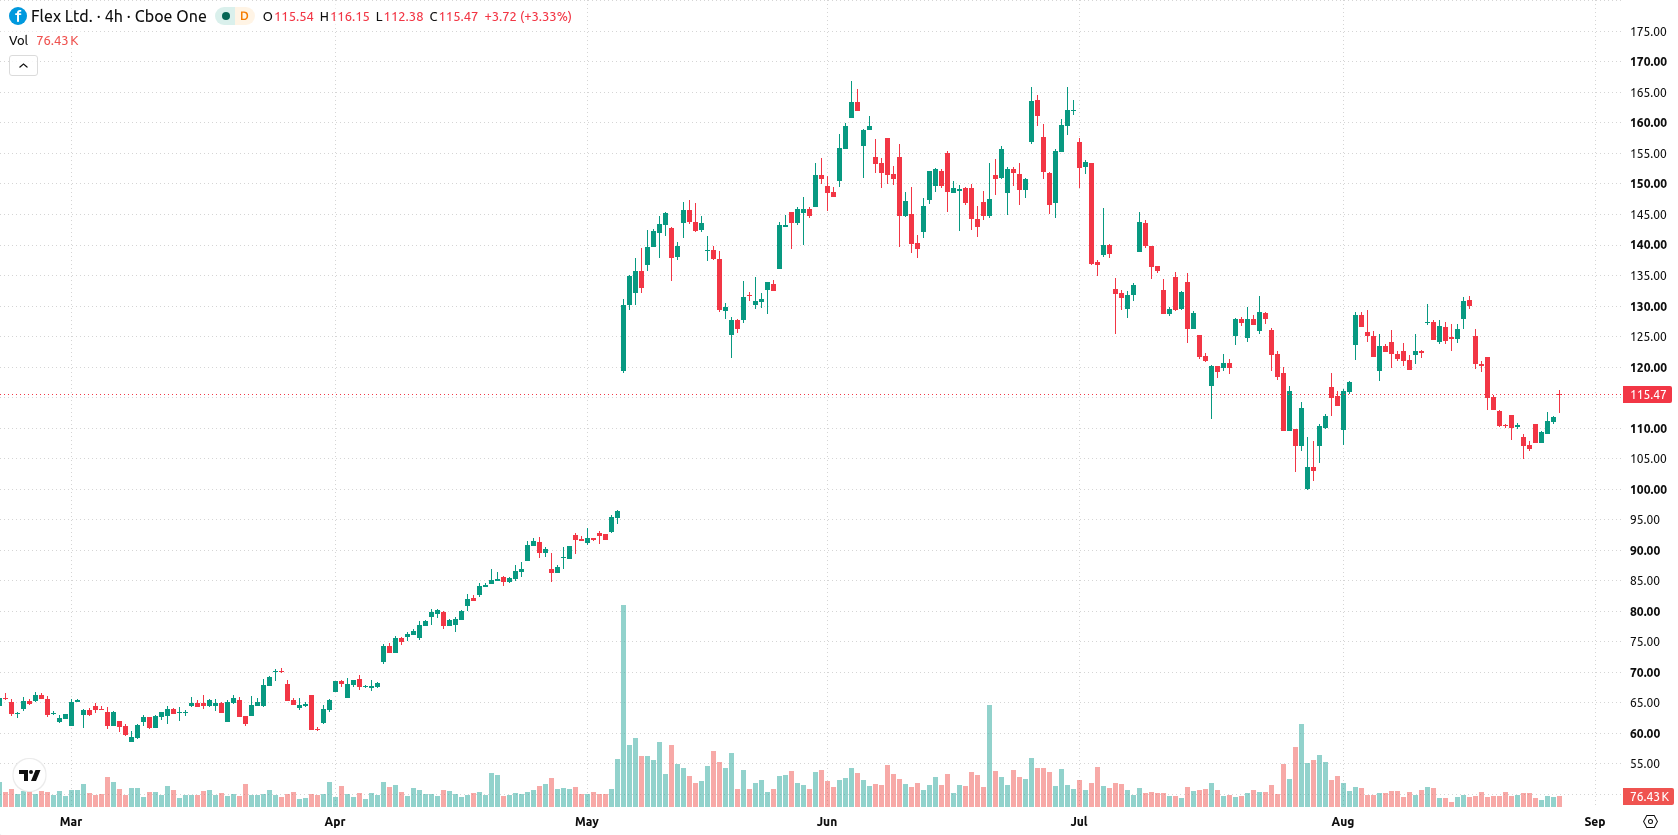
Bearish momentum dominates despite rebound off long-term support
FLEX is trading below its 20-day and 50-day moving averages ($118.23 and $128.88), but remains well above the 200-day moving average at $93.16. This setup signals continued long-term strength, with near-term and medium-term softness. The nearest resistance is at $115.59 (Ichimoku Kijun) and support is at $112.52 (week high), with broader trend confirmation from the elevated longer-term moving averages. Momentum signals are mixed: the MACD points to selling pressure, the ADX is neutral at 18.2, and both the RSI and CCI remain in sell territory, approaching oversold levels. The Bull/Bear Power is negative at -2.66 and the Awesome Oscillator is also negative, confirming sellers are dominating intraday momentum even as prices recover. FLEX saw an upside gap at the open and is trading near the session high, but intraday volatility is high at 3.18%. The technical tone shows a strong rebound off the lows but persistent bearish momentum.
Earlier, analysts noted that Flex was demonstrating bullish technical momentum, with traders watching for a potential breakout as mixed signals emerged from overbought indicators and resistance levels. The latest analysis signals a shift toward near-term weakness despite a strong rebound, making the $115.59 resistance level critical for assessing any renewed upside momentum in the coming sessions.






Latest Flex Ltd News




-
 Afghanistan
-
 Albania
-
 Algeria
-
 Angola
-
 Argentina
-
 Armenia
-
 Australia
-
 Austria
-
 Azerbaijan
-
 Bahamas
-
 Bahrain
-
 Bangladesh
-
 Belarus
-
 Belgium
-
 Bolivia
-
 Botswana
-
 Brazil
-
 Brunei
-
 Bulgaria
-
 Cambodia
-
 Cameroon
-
 Canada
-
 Chile
-
 China
-
 Colombia
-
 Congo
-
 Costa Rica
-
 Cote d'Ivoire
-
 Croatia
-
 Cuba
-
 Cyprus
-
 Czechia
-
 DR Congo
-
 Denmark
-
 Dominican Republic
-
 Ecuador
-
 Egypt
-
 El Salvador
-
 Estonia
-
 Eswatini
-
 Ethiopia
-
 Finland
-
 France
-
 Georgia
-
 Germany
-
 Ghana
-
 Greece
-
 Haiti
-
 Hong Kong
-
 Hungary
-
 India
-
 Indonesia
-
 Iran, Islamic republic
-
 Iraq
-
 Ireland
-
 Israel
-
 Italy
-
 Jamaica
-
 Japan
-
 Jordan
-
 Kazakhstan
-
 Kenya
-
 Korea
-
 Kuwait
-
 Kyrgyzstan
-
 Laos
-
 Latvia
-
 Lebanon
-
 Lesotho
-
 Libya
-
 Lithuania
-
 Luxembourg
-
 Madagascar
-
 Malaysia
-
 Malta
-
 Mauritius
-
 Mexico
-
 Moldova
-
 Mongolia
-
 Montenegro
-
 Morocco
-
 Mozambique
-
 Myanmar
-
 Namibia
-
 Nepal
-
 Netherlands
-
 New Zealand
-
 Nigeria
-
 North Macedonia
-
 Norway
-
 Oman
-
 Pakistan
-
 Palestine
-
 Panama
-
 Papua New Guinea
-
 Paraguay
-
 Peru
-
 Philippines
-
 Poland
-
 Portugal
-
 Puerto Rico
-
 Qatar
-
 Reunion
-
 Romania
-
 Rwanda
-
 Saudi Arabia
-
 Serbia
-
 Singapore
-
 Slovakia
-
 Slovenia
-
 Somalia
-
 South Africa
-
 Spain
-
 Sri Lanka
-
 Sweden
-
 Switzerland
-
 Syria
-
 Taiwan
-
 Tajikistan
-
 Tanzania
-
 Thailand
-
 Trinidad and Tobago
-
 Tunisia
-
 Turkey
-
 UAE
-
 Uganda
-
 Ukraine
-
 United Kingdom
-
United States
-
 Uruguay
-
 Uzbekistan
-
 Venezuela
-
 Vietnam
-
 Yemen
-
 Zambia
-
 Zimbabwe
- Forex
- Crypto












