


Verizon Communications Inc. (VZ) fell 1.54% as sellers gained the upper hand despite a bullish news backdrop, with the company accelerating its rollout of Gemini Enterprise AI tools in partnership with Google Cloud across key operations. The move contradicts the prevailing bullish structure on the charts, as VZ trades above its 20-, 50-, and 200-day moving averages, reinforcing the sense of short-term divergence.
 45.25
45.31
Highlights
- Verizon deepened its Google Cloud partnership, integrating Gemini Enterprise AI across operations and now routing most inbound calls through Gemini tools.
- Institutional investors such as Danske Bank and Commerzbank increased their Verizon holdings, while First National Bank of Omaha reduced its position and Stevens Capital Partners added a new stake.
- Shares of Verizon trade at $49.41 with technicals indicating overbought conditions, a bullish structure across all timeframes, and a five-session expected range of $48.58 to $50.17.
Support from investors and accolades as shares face persistent selling
Verizon expanded its partnership with Google Cloud, integrating Gemini Enterprise AI tools into customer service, network operations, marketing, and internal workflows, where Gemini now handles most inbound calls. Recent filings showed institutional investors such as Danske Bank A S, Commerzbank Aktiengesellschaft FI, and Danica Pension Livsforsikringsaktieselskab raised their holdings, while First National Bank of Omaha reduced its position and Stevens Capital Partners initiated a new stake. Executive Vice President and Group CEO for Verizon Business, Kyle Malady, sold 1,100 shares of company stock for $55,066 on August 25, 2026, under a pre-arranged trading plan. Verizon Business ranked first in the JD Power 2026 internet services study for medium businesses and most categories for large enterprises, and the company declared a quarterly dividend of $0.7075 per share with the dividend yield above 5.6%, though price action has remained under broader selling pressure.
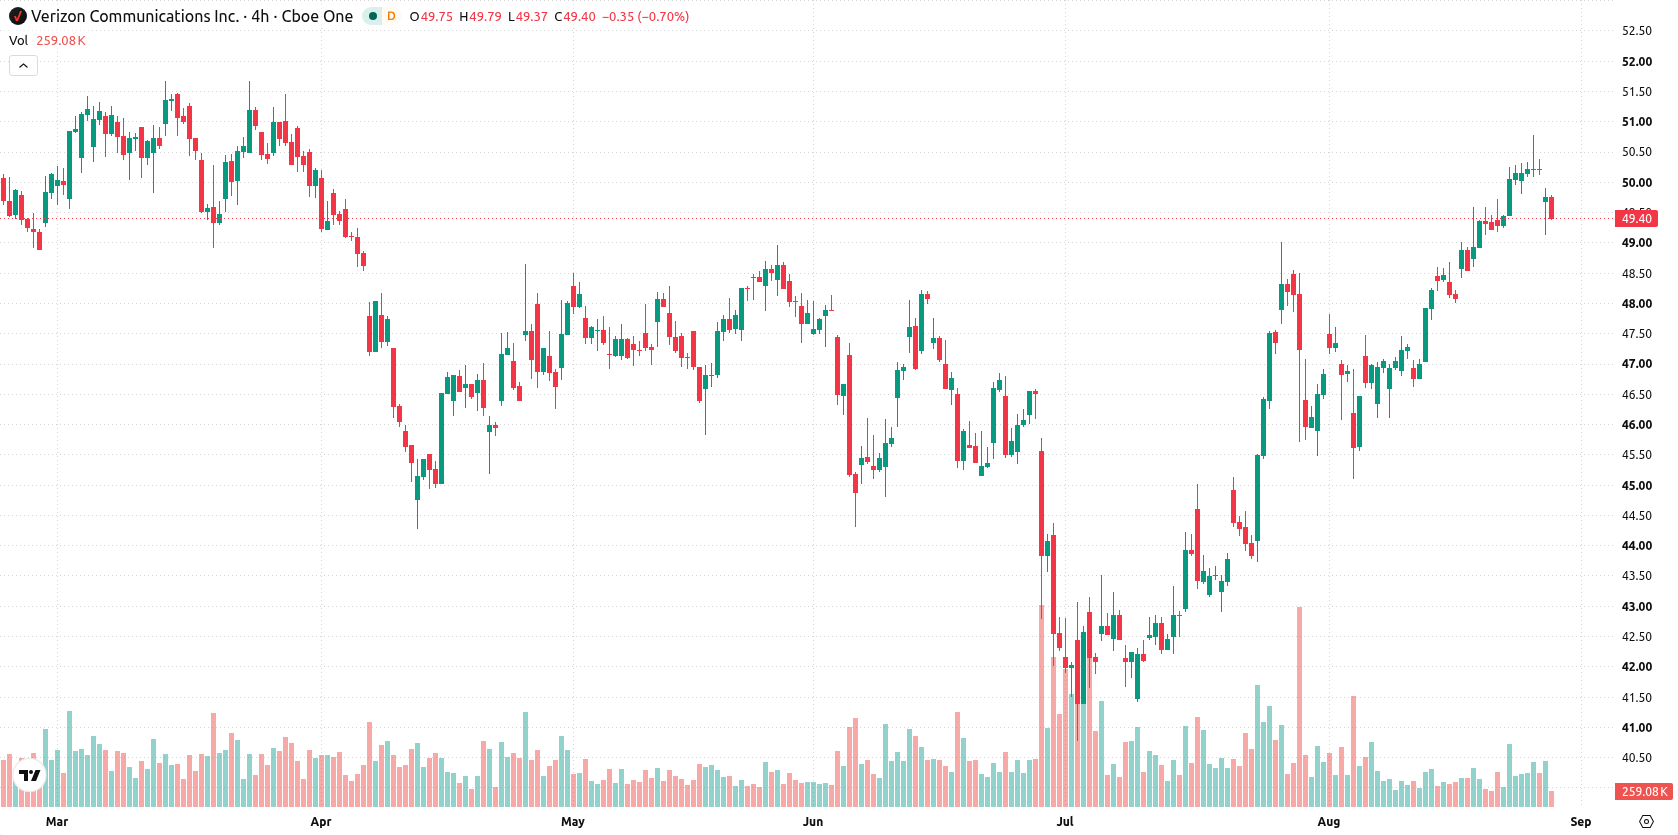
Momentum highs diverge from downside gap after overbought signals
Verizon is trading above its 20-day, 50-day, and 200-day moving averages ($47.89, $45.77, $45.33), confirming bullish structure across short-, medium-, and long-term trends. The current near-term ceiling is $49.90 and the near-term floor is $49.25, framing an intraday range at the upper end of the recent price channel. Momentum readings are mixed: the MACD signals buy, the ADX is neutral. Overbought signals are strong, with the RSI at 70.65, Stochastic RSI at 100, CCI at 140.95, and BBP at 1.66, indicating clear buyer dominance with an overbought forecast. The AO also supports the prevailing bullish bias. Despite this, the stock has declined to $49.41, down 1.54% on the day, opening with a downside gap of about 1.79%. The price is currently near its intraday low, volatility stands at 1.46%, and intraday tone points to weakness after the open. There is a clear divergence between sustained momentum highs and short-term selling pressure in today’s performance.
Earlier, analysts noted that Verizon shares were consolidating below key resistance, with technical momentum suggesting the potential for further gains pending a decisive breakout. The latest developments highlight a shift in the short-term setup, as emerging downside pressures amid ongoing overbought signals make the $49.25 floor a critical level to monitor for potential reversal or renewed upward momentum.






Latest Verizon News



-
 Afghanistan
-
 Albania
-
 Algeria
-
 Angola
-
 Argentina
-
 Armenia
-
 Australia
-
 Austria
-
 Azerbaijan
-
 Bahamas
-
 Bahrain
-
 Bangladesh
-
 Belarus
-
 Belgium
-
 Bolivia
-
 Botswana
-
 Brazil
-
 Brunei
-
 Bulgaria
-
 Cambodia
-
 Cameroon
-
 Canada
-
 Chile
-
 China
-
 Colombia
-
 Congo
-
 Costa Rica
-
 Cote d'Ivoire
-
 Croatia
-
 Cuba
-
 Cyprus
-
 Czechia
-
 DR Congo
-
 Denmark
-
 Dominican Republic
-
 Ecuador
-
 Egypt
-
 El Salvador
-
 Estonia
-
 Eswatini
-
 Ethiopia
-
 Finland
-
 France
-
 Georgia
-
 Germany
-
 Ghana
-
 Greece
-
 Haiti
-
 Hong Kong
-
 Hungary
-
 India
-
 Indonesia
-
 Iran, Islamic republic
-
 Iraq
-
 Ireland
-
 Israel
-
 Italy
-
 Jamaica
-
 Japan
-
 Jordan
-
 Kazakhstan
-
 Kenya
-
 Korea
-
 Kuwait
-
 Kyrgyzstan
-
 Laos
-
 Latvia
-
 Lebanon
-
 Lesotho
-
 Libya
-
 Lithuania
-
 Luxembourg
-
 Madagascar
-
 Malaysia
-
 Malta
-
 Mauritius
-
 Mexico
-
 Moldova
-
 Mongolia
-
 Montenegro
-
 Morocco
-
 Mozambique
-
 Myanmar
-
 Namibia
-
 Nepal
-
 Netherlands
-
 New Zealand
-
 Nigeria
-
 North Macedonia
-
 Norway
-
 Oman
-
 Pakistan
-
 Palestine
-
 Panama
-
 Papua New Guinea
-
 Paraguay
-
 Peru
-
 Philippines
-
 Poland
-
 Portugal
-
 Puerto Rico
-
 Qatar
-
 Reunion
-
 Romania
-
 Rwanda
-
 Saudi Arabia
-
 Serbia
-
 Singapore
-
 Slovakia
-
 Slovenia
-
 Somalia
-
 South Africa
-
 Spain
-
 Sri Lanka
-
 Sweden
-
 Switzerland
-
 Syria
-
 Taiwan
-
 Tajikistan
-
 Tanzania
-
 Thailand
-
 Trinidad and Tobago
-
 Tunisia
-
 Turkey
-
 UAE
-
 Uganda
-
 Ukraine
-
 United Kingdom
-
United States
-
 Uruguay
-
 Uzbekistan
-
 Venezuela
-
 Vietnam
-
 Yemen
-
 Zambia
-
 Zimbabwe
- Forex
- Crypto












