

GFS slides nearly 4% as technical indicators confirm persistent selling pressure

GlobalFoundries Inc (GFS) dropped 3.81% as persistent technical weakness and sustained selling pressure drove renewed downside momentum. The move is supported by the stock's position below all major moving averages and continued dominance of bearish momentum signals.
 43.29
46.99
Highlights
- Shares of GlobalFoundries trade below all key moving averages, indicating sustained negative pressure across timeframes.
- Technical indicators show oversold conditions and strong seller dominance, with momentum and oscillator signals confirming ongoing weakness.
- The stock is expected to consolidate between $43.64 and $46.01 in the next 5 sessions, with a 75% probability skewed toward further downside.
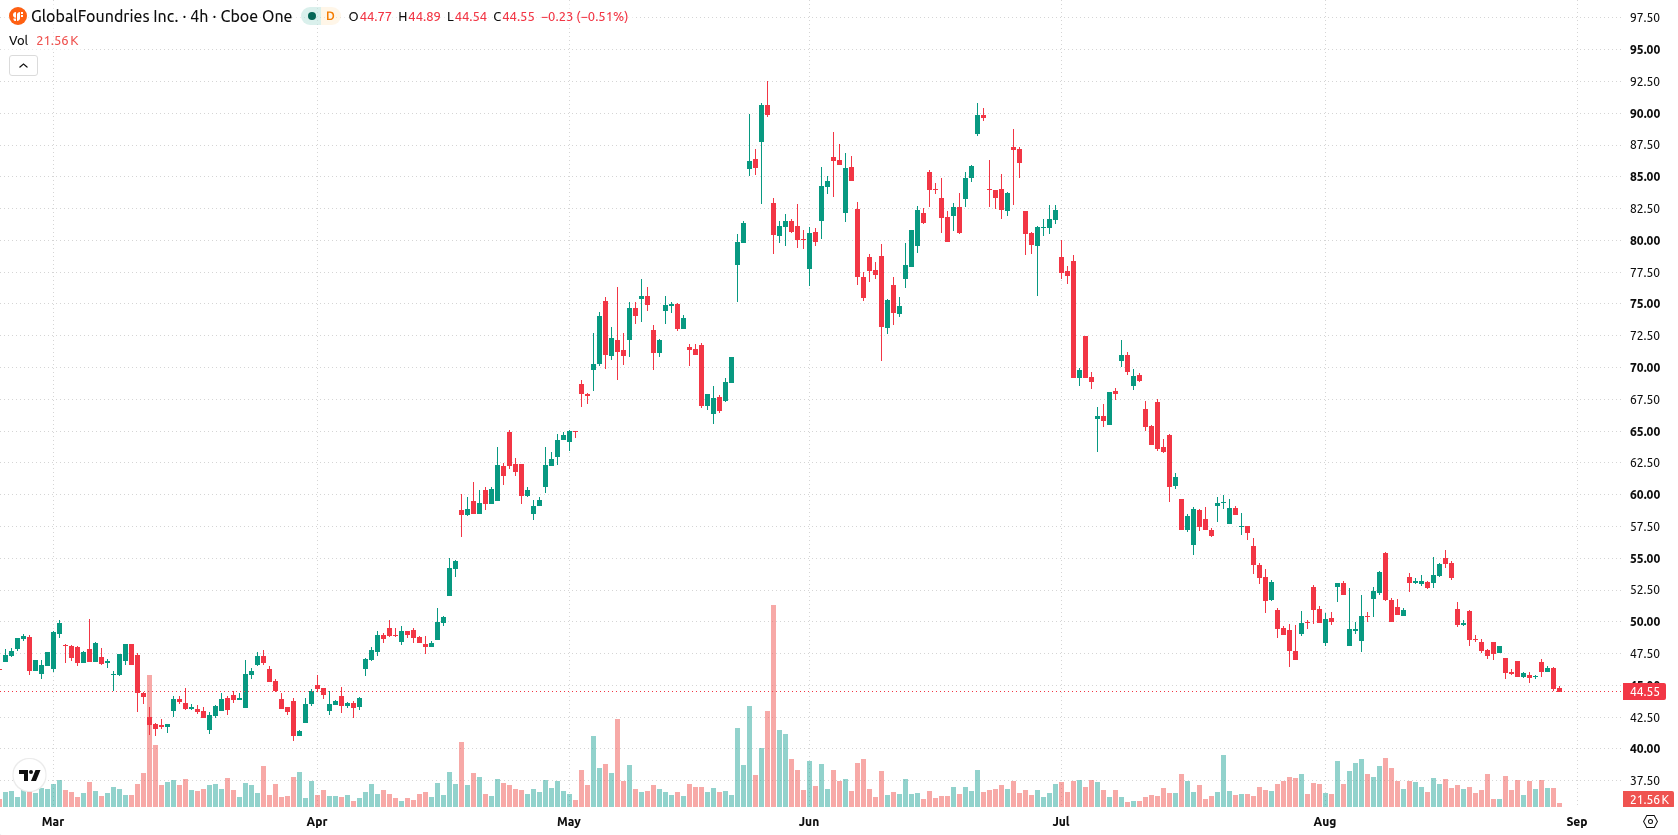
Selling pressure dominates as all momentum signals confirm oversold status
GlobalFoundries is trading below all key moving averages, with the current price under the MA-20 ($49.92), MA-50 ($60.56), and MA-200 ($52.97). This alignment signals persistent pressure from sellers in the short, medium, and long term, and the Ichimoku Kijun ($51.88) confirms resistance above. Near-term, the stock faces ceiling resistance at $45.21 and a floor at $43.64. Momentum readings are negative, with the Moving Average Convergence Divergence (MACD) at -4.18 (Strong Sell) and the Average Directional Index (ADX) at 27.16 also in Sell territory. The Relative Strength Index (RSI) at 36.02, Stochastic RSI at 14.87, and Commodity Channel Index (CCI) at -112.59 all flag the stock as oversold. Bull/Bear Power (BBP) at -1.67 indicates sellers dominate intraday momentum, matching the oversold outlook. The stock is down to $44.59, a drop of 3.81% after a downside gap of roughly $0.11, and is now trading near its intraday low. Intraday volatility stands at 1.86%, reflecting a clear tone of persistent selling pressure after the open. Despite the Hull Moving Average (HMA) suggesting a Strong Buy, most momentum and oscillator signals confirm the current weakness.
Earlier, analysts noted that GlobalFoundries was experiencing sustained bearish pressure and technical weakness across all major moving averages. The latest analysis reinforces this view, with persistently negative momentum indicators underscoring the importance of monitoring the $43.64 support level as a pivotal risk for further downside.






Latest GlobalFoundries Inc News




-
 Afghanistan
-
 Albania
-
 Algeria
-
 Angola
-
 Argentina
-
 Armenia
-
 Australia
-
 Austria
-
 Azerbaijan
-
 Bahamas
-
 Bahrain
-
 Bangladesh
-
 Belarus
-
 Belgium
-
 Bolivia
-
 Botswana
-
 Brazil
-
 Brunei
-
 Bulgaria
-
 Cambodia
-
 Cameroon
-
 Canada
-
 Chile
-
 China
-
 Colombia
-
 Congo
-
 Costa Rica
-
 Cote d'Ivoire
-
 Croatia
-
 Cuba
-
 Cyprus
-
 Czechia
-
 DR Congo
-
 Denmark
-
 Dominican Republic
-
 Ecuador
-
 Egypt
-
 El Salvador
-
 Estonia
-
 Eswatini
-
 Ethiopia
-
 Finland
-
 France
-
 Georgia
-
 Germany
-
 Ghana
-
 Greece
-
 Haiti
-
 Hong Kong
-
 Hungary
-
 India
-
 Indonesia
-
 Iran, Islamic republic
-
 Iraq
-
 Ireland
-
 Israel
-
 Italy
-
 Jamaica
-
 Japan
-
 Jordan
-
 Kazakhstan
-
 Kenya
-
 Korea
-
 Kuwait
-
 Kyrgyzstan
-
 Laos
-
 Latvia
-
 Lebanon
-
 Lesotho
-
 Libya
-
 Lithuania
-
 Luxembourg
-
 Madagascar
-
 Malaysia
-
 Malta
-
 Mauritius
-
 Mexico
-
 Moldova
-
 Mongolia
-
 Montenegro
-
 Morocco
-
 Mozambique
-
 Myanmar
-
 Namibia
-
 Nepal
-
 Netherlands
-
 New Zealand
-
 Nigeria
-
 North Macedonia
-
 Norway
-
 Oman
-
 Pakistan
-
 Palestine
-
 Panama
-
 Papua New Guinea
-
 Paraguay
-
 Peru
-
 Philippines
-
 Poland
-
 Portugal
-
 Puerto Rico
-
 Qatar
-
 Reunion
-
 Romania
-
 Rwanda
-
 Saudi Arabia
-
 Serbia
-
 Singapore
-
 Slovakia
-
 Slovenia
-
 Somalia
-
 South Africa
-
 Spain
-
 Sri Lanka
-
 Sweden
-
 Switzerland
-
 Syria
-
 Taiwan
-
 Tajikistan
-
 Tanzania
-
 Thailand
-
 Trinidad and Tobago
-
 Tunisia
-
 Turkey
-
 UAE
-
 Uganda
-
 Ukraine
-
 United Kingdom
-
United States
-
 Uruguay
-
 Uzbekistan
-
 Venezuela
-
 Vietnam
-
 Yemen
-
 Zambia
-
 Zimbabwe
- Forex
- Crypto












