

PG&E stock slumps around 6.5% as technical momentum pressures shares

PG&E Corporation (PCG) slumped 6.43% today under broad-based selling pressure, as technical momentum provided the main driver in the absence of fresh company news. The move is supported by the stock breaking below all its major moving averages, highlighting a pronounced shift in sentiment.
 13.36
13.40
Highlights
- Shares of PG&E fell 6.43% to $16.81, trading below all key moving averages and showing broad seller pressure.
- Technical indicators present a mixed short-term outlook, with buying momentum evident but some oscillators turning neutral to negative.
- PG&E stock is projected to trade within a $14.93 to $17.24 range over five days, with high probability of stabilization or an upward move unless $14.93 is breached.
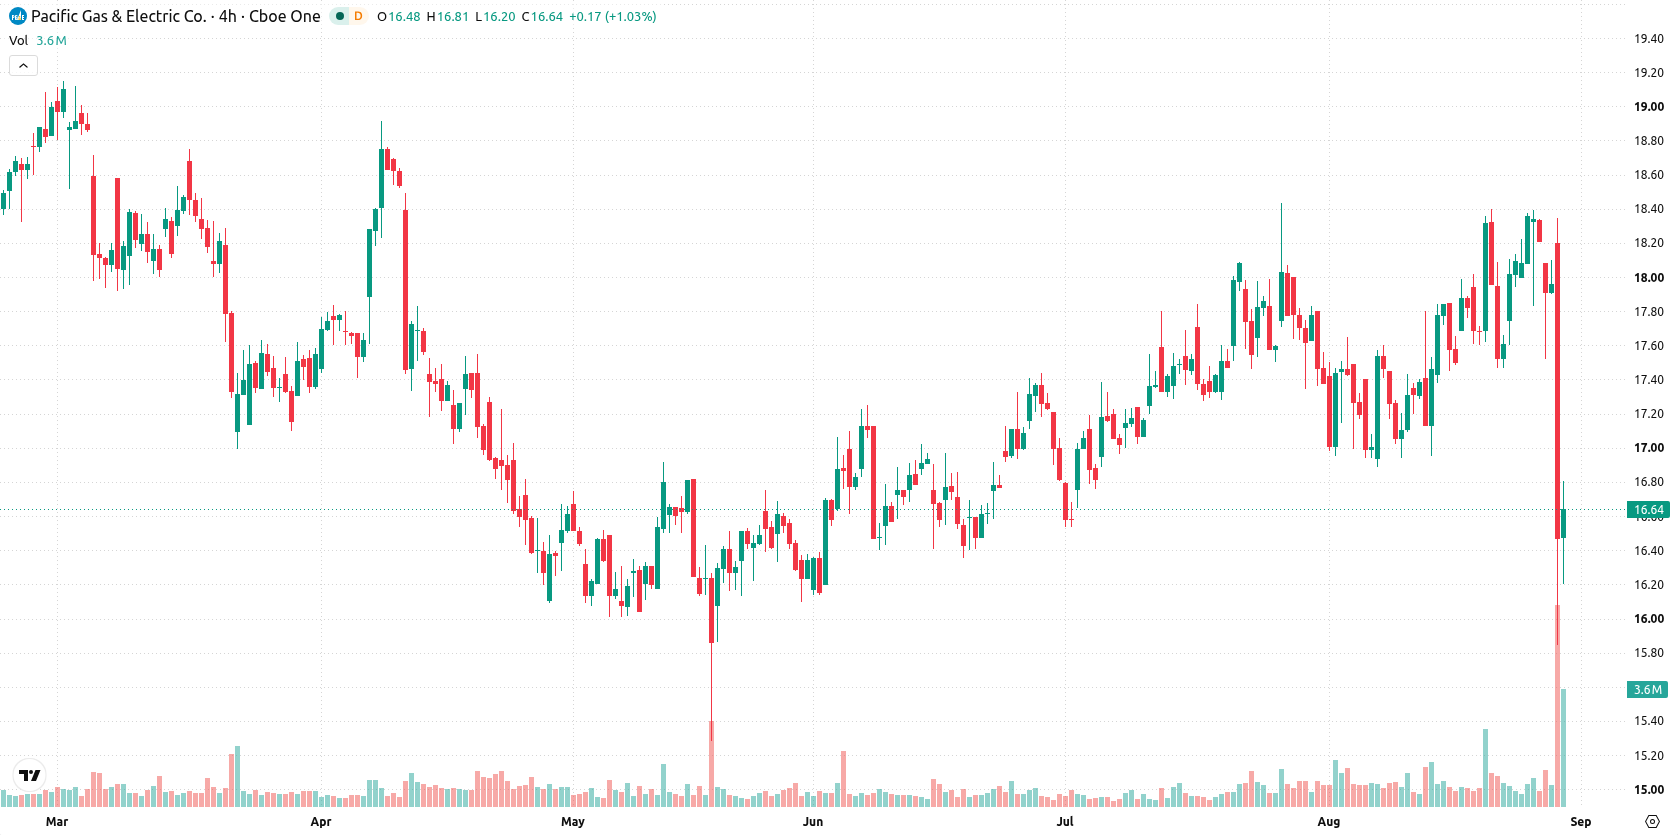
Mixed momentum signals as PCG nears support after broad technical breach
PG&E has fallen below all its key short-, medium-, and long-term moving averages: MA-20 at $17.6, MA-50 at $17.39, and MA-200 at $16.83, underscoring broad-based seller pressure. The immediate technical landscape defines the near-term ceiling at $16.83 and the near-term floor much lower at $14.93, with long-term alignment still bullish as MA-50 remains above MA-200. Momentum signals show a mixed intraday picture. Both the MACD and Average Directional Index (ADX) remain supportive of further upside, and the Relative Strength Index (RSI) at 54.71 indicates buying momentum with no overbought risk. The Bull/Bear Power (BBP) at 0.26 signals that buyers still dominate intraday, but the stock has dropped to $16.81, down $1.155 or 6.43% today after an upside gap of $0.28 (1.56%). The price is now trading near the low of the day. Intraday volatility stands at 1.16%, reflecting sharp pressure after the open. Some oscillators such as the Hull Moving Average (HMA), at $18.28, and the Stochastic RSI at 59.7 show neutral to negative undertones, highlighting divergences in momentum signals relative to current price action.
Previously it was reported that PG&E maintained a constructive technical outlook as undergrounding initiatives advanced and shares tested key resistance. Today’s sharp drop below major moving averages marks a material shift, with the $16.83 level now acting as an important near-term ceiling for traders to monitor.






Latest PG&E Corporation News



-
 Afghanistan
-
 Albania
-
 Algeria
-
 Angola
-
 Argentina
-
 Armenia
-
 Australia
-
 Austria
-
 Azerbaijan
-
 Bahamas
-
 Bahrain
-
 Bangladesh
-
 Belarus
-
 Belgium
-
 Bolivia
-
 Botswana
-
 Brazil
-
 Brunei
-
 Bulgaria
-
 Cambodia
-
 Cameroon
-
 Canada
-
 Chile
-
 China
-
 Colombia
-
 Congo
-
 Costa Rica
-
 Cote d'Ivoire
-
 Croatia
-
 Cuba
-
 Cyprus
-
 Czechia
-
 DR Congo
-
 Denmark
-
 Dominican Republic
-
 Ecuador
-
 Egypt
-
 El Salvador
-
 Estonia
-
 Eswatini
-
 Ethiopia
-
 Finland
-
 France
-
 Georgia
-
 Germany
-
 Ghana
-
 Greece
-
 Haiti
-
 Hong Kong
-
 Hungary
-
 India
-
 Indonesia
-
 Iran, Islamic republic
-
 Iraq
-
 Ireland
-
 Israel
-
 Italy
-
 Jamaica
-
 Japan
-
 Jordan
-
 Kazakhstan
-
 Kenya
-
 Korea
-
 Kuwait
-
 Kyrgyzstan
-
 Laos
-
 Latvia
-
 Lebanon
-
 Lesotho
-
 Libya
-
 Lithuania
-
 Luxembourg
-
 Madagascar
-
 Malaysia
-
 Malta
-
 Mauritius
-
 Mexico
-
 Moldova
-
 Mongolia
-
 Montenegro
-
 Morocco
-
 Mozambique
-
 Myanmar
-
 Namibia
-
 Nepal
-
 Netherlands
-
 New Zealand
-
 Nigeria
-
 North Macedonia
-
 Norway
-
 Oman
-
 Pakistan
-
 Palestine
-
 Panama
-
 Papua New Guinea
-
 Paraguay
-
 Peru
-
 Philippines
-
 Poland
-
 Portugal
-
 Puerto Rico
-
 Qatar
-
 Reunion
-
 Romania
-
 Rwanda
-
 Saudi Arabia
-
 Serbia
-
 Singapore
-
 Slovakia
-
 Slovenia
-
 Somalia
-
 South Africa
-
 Spain
-
 Sri Lanka
-
 Sweden
-
 Switzerland
-
 Syria
-
 Taiwan
-
 Tajikistan
-
 Tanzania
-
 Thailand
-
 Trinidad and Tobago
-
 Tunisia
-
 Turkey
-
 UAE
-
 Uganda
-
 Ukraine
-
 United Kingdom
-
United States
-
 Uruguay
-
 Uzbekistan
-
 Venezuela
-
 Vietnam
-
 Yemen
-
 Zambia
-
 Zimbabwe
- Forex
- Crypto












