

Disney shares weekly forecast: Stochastic RSI slips into oversold zone as consolidation continues

Shares of The Walt Disney Company (DIS) are trading near $107 as the stock extends its recovery, but faces caution with technical signals pointing toward an overbought risk. The week ahead hinges on whether recent gains can be sustained amid renewed corporate momentum and consolidation warning signs.
 111.88
112.30
Highlights
- Shares of Disney closed at $107.14, declining $0.98 over the past 7 days but remaining above major daily moving averages.
- Price action has consolidated in a narrow range with recent 7-day volatility at 4.53% and a flat trend developing.
- Disney stock is expected to trade between $104.97 and $113.97, with a base case of consolidation between $106.76 support and $111.6 resistance.
Earnings-driven rally as record experiences revenue lifts sentiment
Disney surprised investors with stronger-than-expected fiscal third-quarter results, reporting record Experiences revenue and operating income growth, as highlighted by Yahoo Finance and The Motley Fool. The company benefited from a 10% year-over-year increase in Experiences revenue, aided by higher global guest counts and per-capita park spending, while its streaming segment more than doubled operating income and theatrical successes boosted sentiment. Disney also renewed its full-year guidance, announced major share repurchases, and revealed a voluntary early retirement program for U.S. executives, alongside substantial theme park expansion plans including a new park in Abu Dhabi, according to Fox Business and LA NACION.
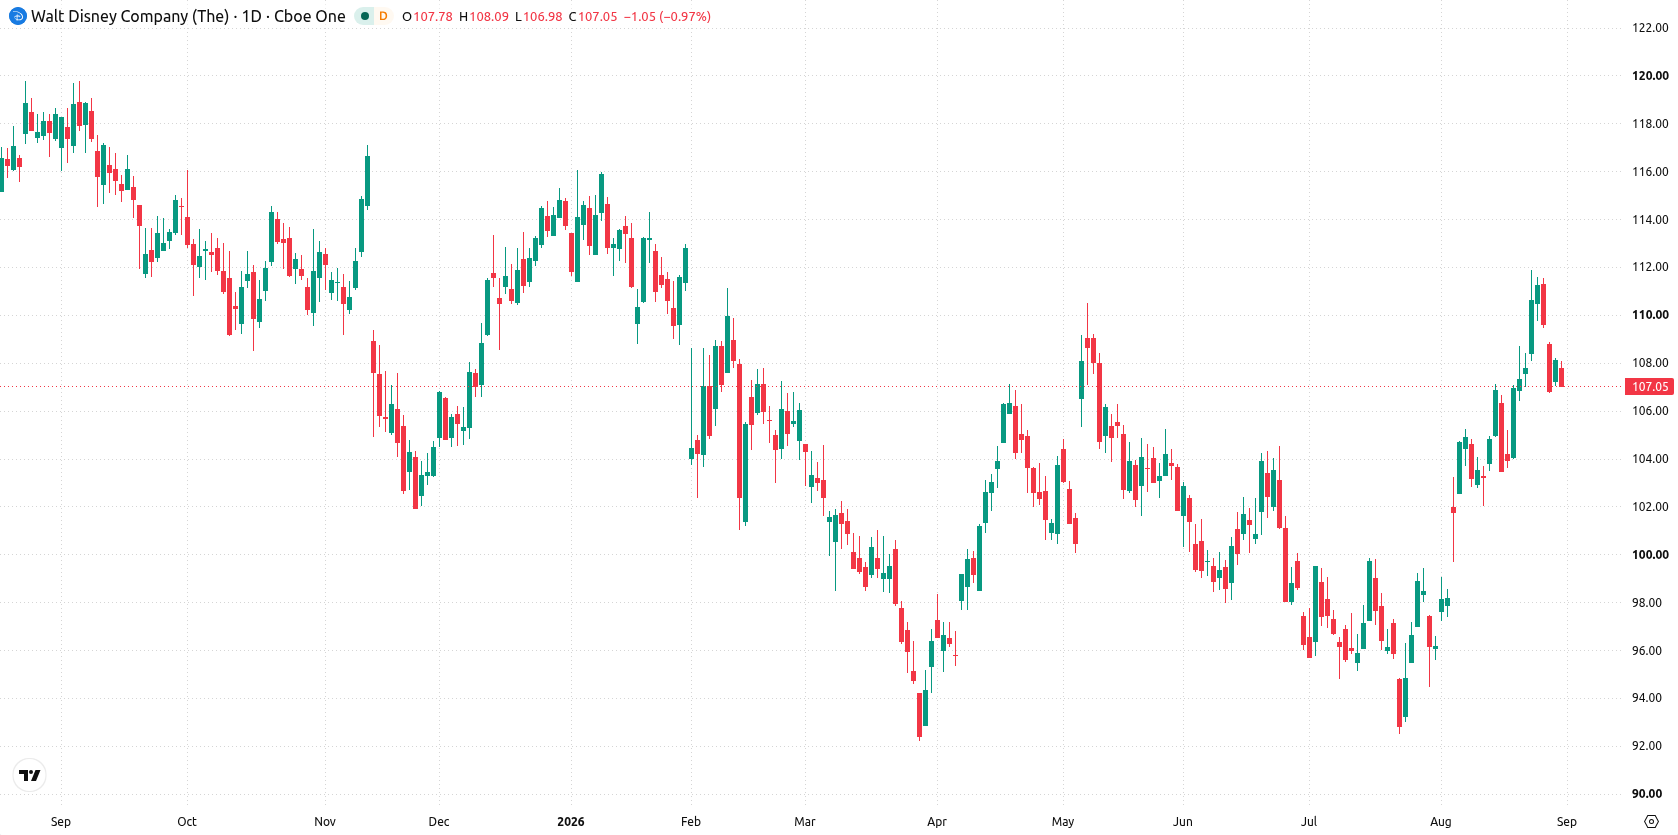
Bullish consolidation persists as volatility narrows over the week
On the daily chart, price action signals a flat trend with a contained move within a narrow range, as recent 7-day volatility sits at 4.53%. The MACD shows buy momentum at 3.21, while the Stochastic RSI has slipped into the oversold zone. Disney is holding right at the nearest support of $106.76, while resistance looms at $111.6. Despite mixed short-term momentum signals, the persistent bullish position above key averages points to consolidation with a mild upward bias.
Upside bias in weekly forecast amid defined breakout levels
In the week ahead, Disney shares are expected to trade within a range of $104.97 to $113.97. There is a very high probability of an increase and a very low probability of a decrease. The base case calls for the stock to consolidate between support at $106.76 and resistance at $111.6. A move above $111.6 would likely trigger fresh buying, while a clear break below $106.76 would open the door to further downside.
Earlier, analysts noted that despite Disney's strong financial results and an expanded buyback program, technical signals highlighted the risk of overbought conditions and the need for caution. With consolidation now prevailing above key support and resistance levels, traders should monitor for a decisive breakout beyond $111.6 or a sustained move below $106.76 to gauge the next directional shift.











-
 Afghanistan
-
 Albania
-
 Algeria
-
 Angola
-
 Argentina
-
 Armenia
-
 Australia
-
 Austria
-
 Azerbaijan
-
 Bahamas
-
 Bahrain
-
 Bangladesh
-
 Belarus
-
 Belgium
-
 Bolivia
-
 Botswana
-
 Brazil
-
 Brunei
-
 Bulgaria
-
 Cambodia
-
 Cameroon
-
 Canada
-
 Chile
-
 China
-
 Colombia
-
 Congo
-
 Costa Rica
-
 Cote d'Ivoire
-
 Croatia
-
 Cuba
-
 Cyprus
-
 Czechia
-
 DR Congo
-
 Denmark
-
 Dominican Republic
-
 Ecuador
-
 Egypt
-
 El Salvador
-
 Estonia
-
 Eswatini
-
 Ethiopia
-
 Finland
-
 France
-
 Georgia
-
 Germany
-
 Ghana
-
 Greece
-
 Haiti
-
 Hong Kong
-
 Hungary
-
 India
-
 Indonesia
-
 Iran, Islamic republic
-
 Iraq
-
 Ireland
-
 Israel
-
 Italy
-
 Jamaica
-
 Japan
-
 Jordan
-
 Kazakhstan
-
 Kenya
-
 Korea
-
 Kuwait
-
 Kyrgyzstan
-
 Laos
-
 Latvia
-
 Lebanon
-
 Lesotho
-
 Libya
-
 Lithuania
-
 Luxembourg
-
 Madagascar
-
 Malaysia
-
 Malta
-
 Mauritius
-
 Mexico
-
 Moldova
-
 Mongolia
-
 Montenegro
-
 Morocco
-
 Mozambique
-
 Myanmar
-
 Namibia
-
 Nepal
-
 Netherlands
-
 New Zealand
-
 Nigeria
-
 North Macedonia
-
 Norway
-
 Oman
-
 Pakistan
-
 Palestine
-
 Panama
-
 Papua New Guinea
-
 Paraguay
-
 Peru
-
 Philippines
-
 Poland
-
 Portugal
-
 Puerto Rico
-
 Qatar
-
 Reunion
-
 Romania
-
 Rwanda
-
 Saudi Arabia
-
 Serbia
-
 Singapore
-
 Slovakia
-
 Slovenia
-
 Somalia
-
 South Africa
-
 Spain
-
 Sri Lanka
-
 Sweden
-
 Switzerland
-
 Syria
-
 Taiwan
-
 Tajikistan
-
 Tanzania
-
 Thailand
-
 Trinidad and Tobago
-
 Tunisia
-
 Turkey
-
 UAE
-
 Uganda
-
 Ukraine
-
 United Kingdom
-
United States
-
 Uruguay
-
 Uzbekistan
-
 Venezuela
-
 Vietnam
-
 Yemen
-
 Zambia
-
 Zimbabwe
- Forex
- Crypto












