

TELUS stock resistance test at C$13.73: Breakout levels to watch

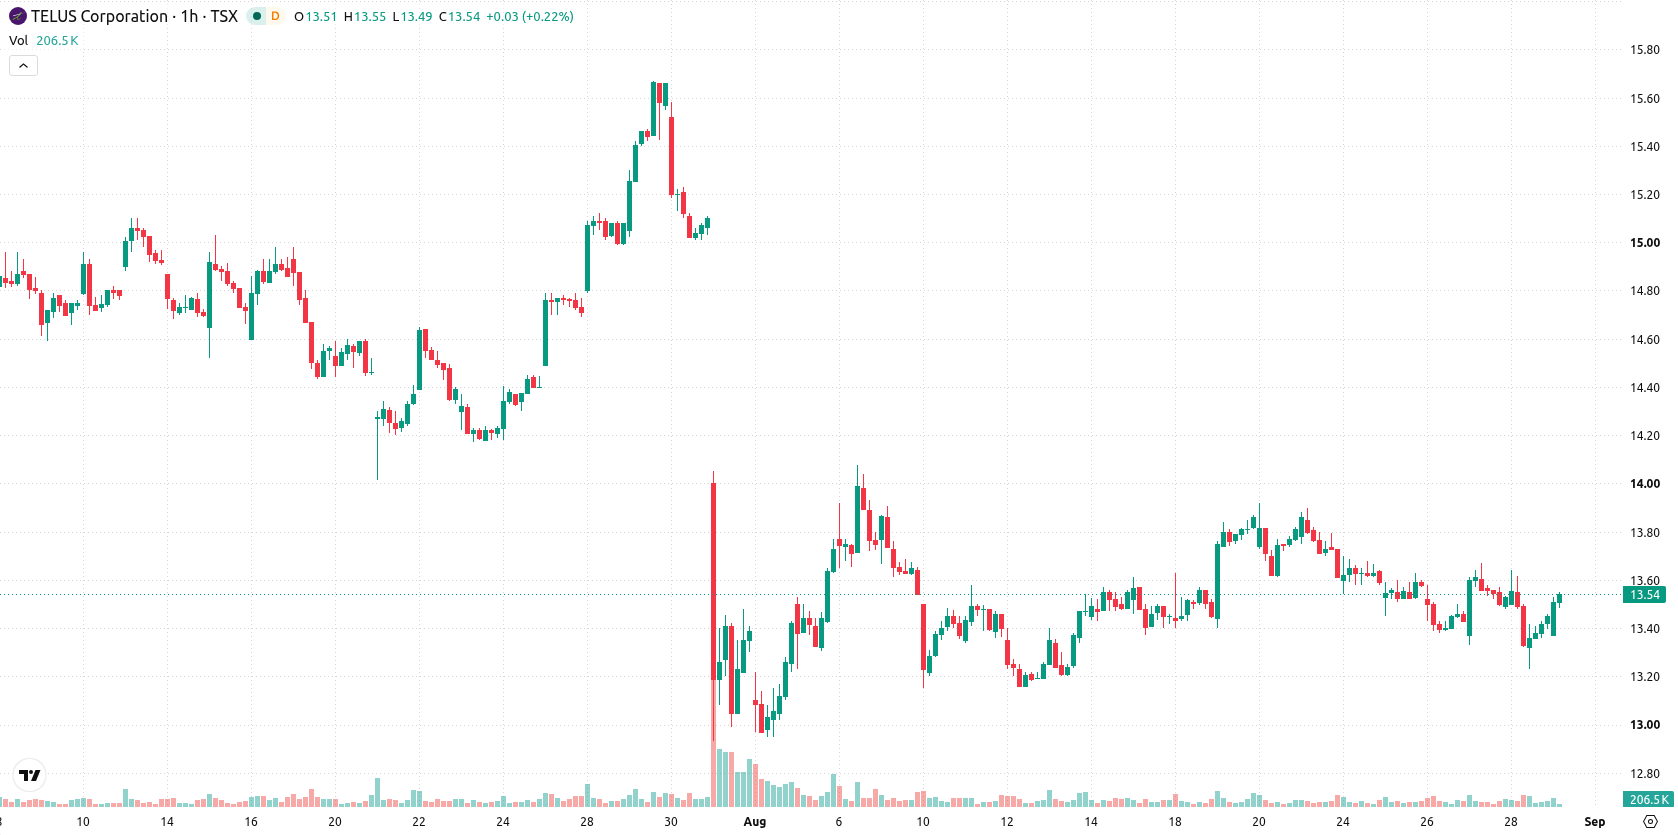
TELUS (T) stock is trading at C$13.54, marking a modest move higher for the session. The price is currently positioned above its short-term moving average but remains below medium- and long-term averages, reflecting only a slight daily advance.
 13.91
12.65
Highlights
- TELUS is building a sovereign AI factory and Canadian sovereign data centres to expand domestic AI and secure data capabilities.
- This infrastructure initiative addresses the rising demand for localized, compliant AI solutions and positions TELUS to attract more enterprise customers.
- Shares of TELUS closed at C$13.54 and are expected to trade between C$13.25 and C$13.73, with technical signals implying a moderately higher likelihood of sideways or bullish price action but weak underlying momentum.
AI infrastructure expansion as local compliance demand drives strategic focus
TELUS is expanding its technological infrastructure by developing a sovereign AI factory and Canadian sovereign data centres, according to Telecomlead. This initiative enhances TELUS's domestic capabilities in artificial intelligence and secure data handling, responding to rising demand for localized and compliant AI solutions. The move may attract enterprise customers and further support TELUS’s strategic position in the Canadian market.
Momentum remains weak as mixed signals confront resistance and temporary support
T is trading just above the MA-20 at C$13.47 but continues to face resistance from the MA-50 at C$13.59, with the longer-term MA-200 far overhead at C$17.1. The Ichimoku Kijun sits at C$13.45, providing immediate support for short-term moves. Momentum indicators are mixed: MACD is flashing a sell signal, ADX suggests a lack of trend strength, and RSI sits at 46.62, below the neutral 50 mark, hinting at lingering bearish momentum. Stochastic RSI and CCI are both neutral, indicating there is no strong impulse in either direction, while Bull/Bear Power favors buyers intraday, reflecting today’s close near the session high despite overall momentum weakness.
Consolidation outlook as breakout risks hinge on technical range
Over the next several trading days, T is likely to remain rangebound between C$13.25 and C$13.73, which reflects a typical volatility band relative to current levels. The probability of an upward move is moderate at 55%, suggesting a slightly higher chance of a bullish breakout above resistance near C$13.73, while a move below support at C$13.25 would tip the scenario bearish. Baseline expectations call for consolidation within this range unless a decisive technical breach occurs.
Earlier, analysts noted that TELUS faced persistent downside risks stemming from dividend reductions and ongoing technical weakness. The current setup introduces a potential shift, as short-term momentum indicators and the company’s technology investments suggest traders should monitor for a breakout above C$13.73 that could signal a reversal of the consolidation trend.









-
 Afghanistan
-
 Albania
-
 Algeria
-
 Angola
-
 Argentina
-
 Armenia
-
 Australia
-
 Austria
-
 Azerbaijan
-
 Bahamas
-
 Bahrain
-
 Bangladesh
-
 Belarus
-
 Belgium
-
 Bolivia
-
 Botswana
-
 Brazil
-
 Brunei
-
 Bulgaria
-
 Cambodia
-
 Cameroon
-
 Canada
-
 Chile
-
 China
-
 Colombia
-
 Congo
-
 Costa Rica
-
 Cote d'Ivoire
-
 Croatia
-
 Cuba
-
 Cyprus
-
 Czechia
-
 DR Congo
-
 Denmark
-
 Dominican Republic
-
 Ecuador
-
 Egypt
-
 El Salvador
-
 Estonia
-
 Eswatini
-
 Ethiopia
-
 Finland
-
 France
-
 Georgia
-
 Germany
-
 Ghana
-
 Greece
-
 Haiti
-
 Hong Kong
-
 Hungary
-
 India
-
 Indonesia
-
 Iran, Islamic republic
-
 Iraq
-
 Ireland
-
 Israel
-
 Italy
-
 Jamaica
-
 Japan
-
 Jordan
-
 Kazakhstan
-
 Kenya
-
 Korea
-
 Kuwait
-
 Kyrgyzstan
-
 Laos
-
 Latvia
-
 Lebanon
-
 Lesotho
-
 Libya
-
 Lithuania
-
 Luxembourg
-
 Madagascar
-
 Malaysia
-
 Malta
-
 Mauritius
-
 Mexico
-
 Moldova
-
 Mongolia
-
 Montenegro
-
 Morocco
-
 Mozambique
-
 Myanmar
-
 Namibia
-
 Nepal
-
 Netherlands
-
 New Zealand
-
 Nigeria
-
 North Macedonia
-
 Norway
-
 Oman
-
 Pakistan
-
 Palestine
-
 Panama
-
 Papua New Guinea
-
 Paraguay
-
 Peru
-
 Philippines
-
 Poland
-
 Portugal
-
 Puerto Rico
-
 Qatar
-
 Reunion
-
 Romania
-
 Rwanda
-
 Saudi Arabia
-
 Serbia
-
 Singapore
-
 Slovakia
-
 Slovenia
-
 Somalia
-
 South Africa
-
 Spain
-
 Sri Lanka
-
 Sweden
-
 Switzerland
-
 Syria
-
 Taiwan
-
 Tajikistan
-
 Tanzania
-
 Thailand
-
 Trinidad and Tobago
-
 Tunisia
-
 Turkey
-
 UAE
-
 Uganda
-
 Ukraine
-
 United Kingdom
-
United States
-
 Uruguay
-
 Uzbekistan
-
 Venezuela
-
 Vietnam
-
 Yemen
-
 Zambia
-
 Zimbabwe
- Forex
- Crypto












