


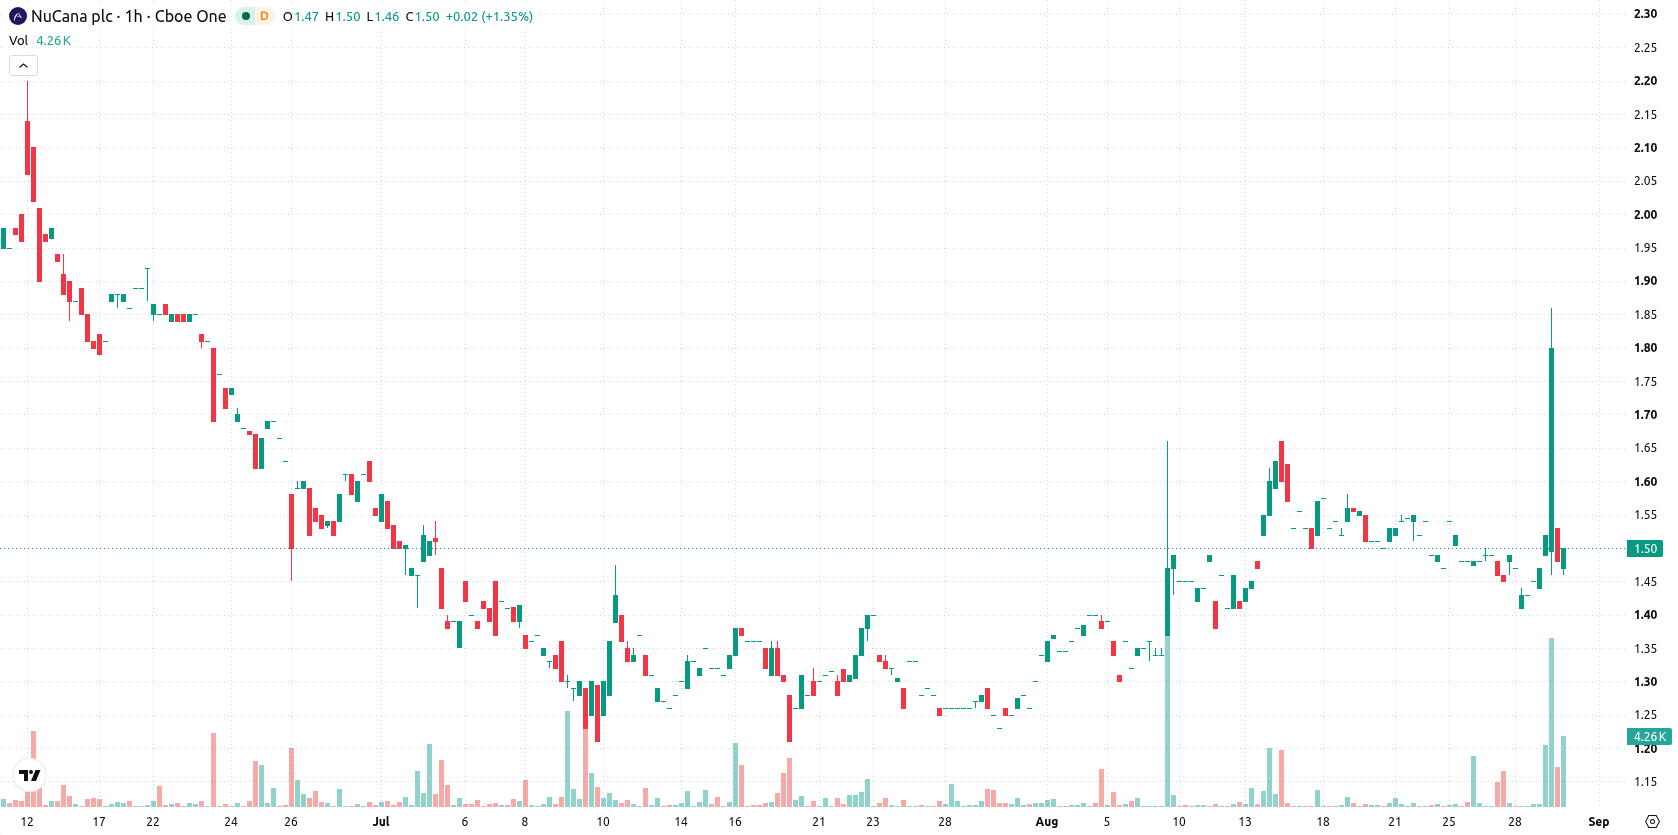
NuCana (NCNA) stock is trading at $1.48, reflecting a 15% decline on the day. The price sits below its key moving averages, marking continued short-term and medium-term weakness.
 1.14
1.19
1.14
1.19
Highlights
- NCNA/USD trades below key moving averages, confirming sustained short- and medium-term downside momentum with seller pressure prevailing.
- Despite some intraday bullish oscillator signals, the price fell 15% to $1.48 and closed near the session low during volatile trading.
- For the next 2 to 3 days, price is expected between $1.33 and $1.87, with a 35% probability of an upward move and immediate resistance at $1.59.
Overbought signals clash with weak price action under resistance
On the hourly chart, NCNA is trading below the MA-20 at $1.49 and MA-50 at $1.5, and it remains well under the long-term MA-200 at $2.3. The Ichimoku Kijun at $1.59 is the nearest resistance. Momentum signals are mixed: RSI is elevated at 76.51, indicating strong buying, while both Stochastic RSI and CCI are overbought. MACD and ADX are neutral, suggesting a lack of clear directional impulse. Bull/Bear Power and the Awesome Oscillator signal strong buyer presence, even as broader price action stays weak.
Downward or sideways bias as range holds with low breakout odds
In the short term, NCNA is likely to fluctuate between $1.33 and $1.87, reflecting the current volatility band. The probability of an upward move is about 35%, making downward or sideways movements more probable. A close above $1.59 could open room for additional gains, while a failure to hold support might see prices test or fall below the lower boundary of the expected range.
Earlier, analysts noted that NuCana's technical setup was showing tentative signs of recovery amid mixed signals. The latest data points to new short- and medium-term weakness, making the $1.59 resistance level critical for any potential rebound in the near term.










-
 Afghanistan
-
 Albania
-
 Algeria
-
 Angola
-
 Argentina
-
 Armenia
-
 Australia
-
 Austria
-
 Azerbaijan
-
 Bahamas
-
 Bahrain
-
 Bangladesh
-
 Belarus
-
 Belgium
-
 Bolivia
-
 Botswana
-
 Brazil
-
 Brunei
-
 Bulgaria
-
 Cambodia
-
 Cameroon
-
 Canada
-
 Chile
Chile
-
 China
China
-
 Colombia
-
 Congo
Congo
-
 Costa Rica
-
 Cote d'Ivoire
-
 Croatia
-
 Cuba
Cuba
-
 Cyprus
-
 Czechia
-
 DR Congo
-
 Denmark
-
 Dominican Republic
-
 Ecuador
-
 Egypt
Egypt
-
 El Salvador
-
 Estonia
-
 Eswatini
-
 Ethiopia
-
 Finland
-
 France
-
 Georgia
-
 Germany
-
 Ghana
Ghana
-
 Greece
-
 Haiti
Haiti
-
 Hong Kong
-
 Hungary
-
 India
India
-
 Indonesia
-
 Iran, Islamic republic
-
 Iraq
Iraq
-
 Ireland
-
 Israel
-
 Italy
Italy
-
 Jamaica
-
 Japan
Japan
-
 Jordan
-
 Kazakhstan
-
 Kenya
Kenya
-
 Korea
Korea
-
 Kuwait
-
 Kyrgyzstan
-
 Laos
Laos
-
 Latvia
-
 Lebanon
-
 Lesotho
-
 Libya
Libya
-
 Lithuania
-
 Luxembourg
-
 Madagascar
-
 Malaysia
-
 Malta
Malta
-
 Mauritius
-
 Mexico
-
 Moldova
-
 Mongolia
-
 Montenegro
-
 Morocco
-
 Mozambique
-
 Myanmar
-
 Namibia
-
 Nepal
Nepal
-
 Netherlands
-
 New Zealand
-
 Nigeria
-
 North Macedonia
-
 Norway
-
 Oman
Oman
-
 Pakistan
-
 Palestine
-
 Panama
-
 Papua New Guinea
-
 Paraguay
-
 Peru
Peru
-
 Philippines
-
 Poland
-
 Portugal
-
 Puerto Rico
-
 Qatar
Qatar
-
 Reunion
-
 Romania
-
 Rwanda
-
 Saudi Arabia
-
 Serbia
-
 Singapore
-
 Slovakia
-
 Slovenia
-
 Somalia
-
 South Africa
-
 Spain
Spain
-
 Sri Lanka
-
 Sweden
-
 Switzerland
-
 Syria
Syria
-
 Taiwan
-
 Tajikistan
-
 Tanzania
-
 Thailand
-
 Trinidad and Tobago
-
 Tunisia
-
 Turkey
-
 UAE
UAE
-
 Uganda
-
 Ukraine
-
 United Kingdom
-
United States
-
 Uruguay
-
 Uzbekistan
-
 Venezuela
-
 Vietnam
-
 Yemen
Yemen
-
 Zambia
-
 Zimbabwe
- Forex
- Crypto












