


Affirm Holdings, Inc. (AFRM) dropped 3.22% after investors unwound positions following the company’s record fourth-quarter earnings, even as robust results set a strong backdrop. The downside is reinforced by the stock slipping below both its 20-day and 50-day moving averages, pointing to increased near-term selling pressure.
 60.09
67.50
Highlights
- Affirm reported fourth-quarter fiscal 2026 Gross Merchandise Volume up 36% year over year to $14.1 billion, exceeding projections.
- Active merchants reached 570,800, operational cash flow for twelve months was $1.2 billion, and card attach rate climbed to 19%.
- Affirm stock trades below short-term averages but above long-term support, with a five-day forecast range of $64.68 to $82.39 and mostly bullish technical signals.
Record earnings and expansion plans met with persistent market selling
Affirm reported strong fourth-quarter fiscal 2026 results, with Gross Merchandise Volume rising 36% year-over-year to $14.1 billion and active merchants increasing to 570,800, both above expectations. Cash generated from operations for the past twelve months reached $1.2 billion, and card adoption grew, with a 19% attach rate and higher spending per cardholder anticipated. The quarter was the most profitable in the firm's history, excluding a tax allowance release, and management highlighted ongoing product, merchant, and international expansion as well as stable credit metrics, though price action has remained under broader selling pressure.
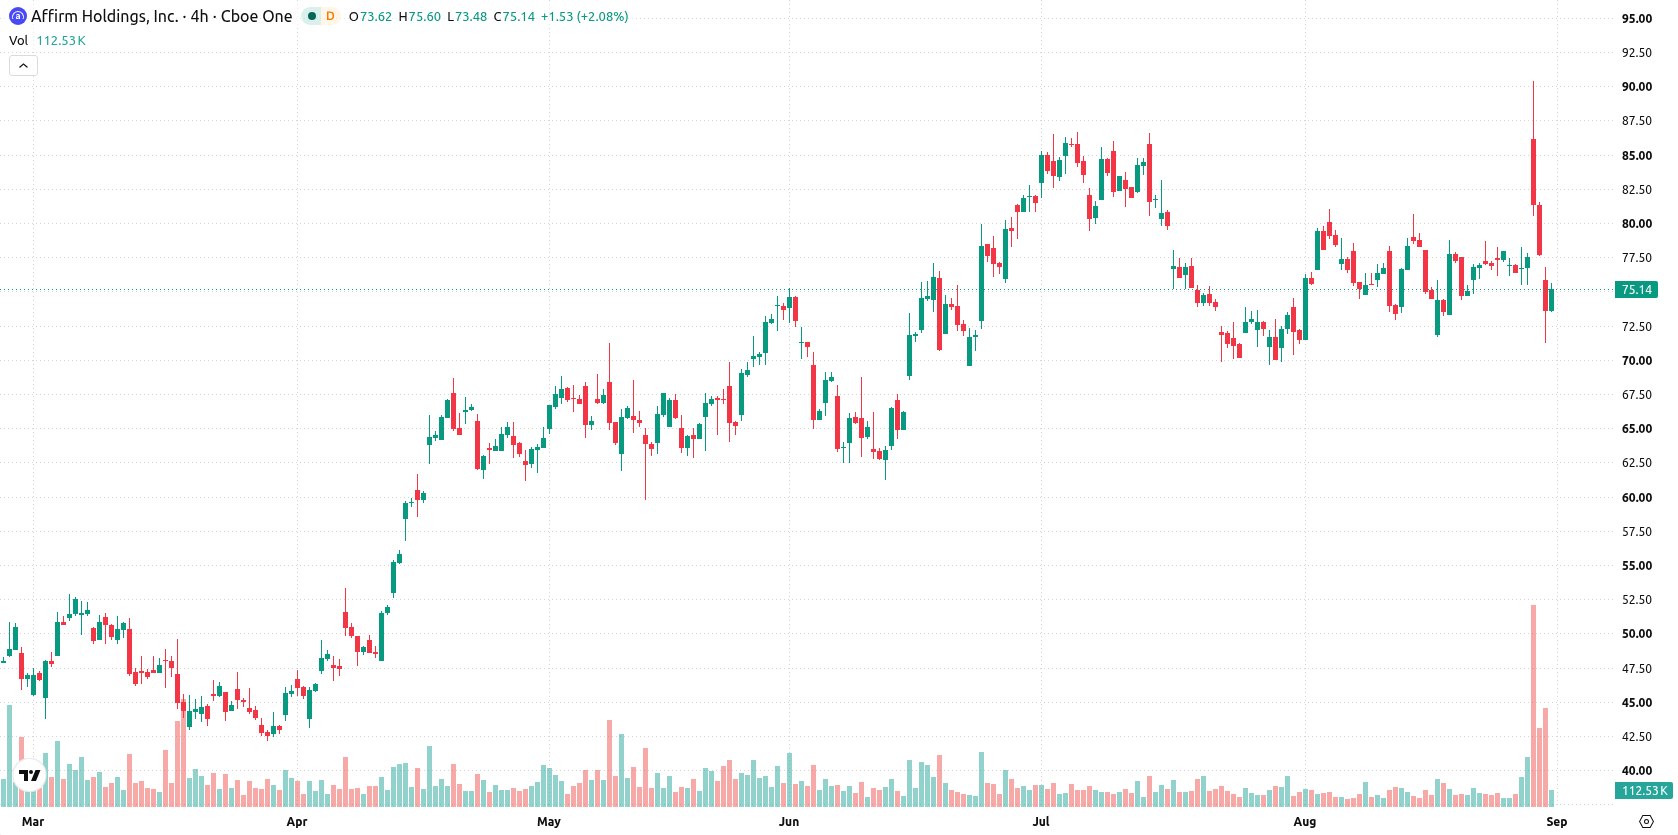
Short-term weakness persists as mixed momentum and overbought signals emerge
Affirm is trading beneath its 20-day ($76.53) and 50-day ($77.24) moving averages, but remains above its 200-day moving average ($66.52). This positions the stock in a zone of short- and medium-term technical weakness, even as the long-term trend is still positive. Resistance is at $75.49, with support at $71.23. Momentum signals are mixed: MACD stays on a buy call, but ADX is weak at 10.29, indicating a lack of defined trend. RSI is neutral and suggests 'Buy', yet both Stochastic RSI and CCI are overbought. BBP stands strongly positive at 13.74, highlighting intraday buyer dominance and signaling overbought conditions. The Awesome Oscillator backs a modest upward bias. Volatility is elevated at 8.03%, and price action recovered toward the intraday high despite an early downside gap.
Earlier, analysts noted that despite Affirm's strong operational performance and positive earnings, technical risks and market skepticism had put the stock under pressure. The latest results reinforce that while fundamental growth remains robust, traders should monitor for a potential breakout above $75.49 or a reversal below $71.23 as key signals for the next directional move.






Latest Affirm News




-
 Afghanistan
-
 Albania
-
 Algeria
-
 Angola
-
 Argentina
-
 Armenia
-
 Australia
-
 Austria
-
 Azerbaijan
-
 Bahamas
-
 Bahrain
-
 Bangladesh
-
 Belarus
-
 Belgium
-
 Bolivia
-
 Botswana
-
 Brazil
-
 Brunei
-
 Bulgaria
-
 Cambodia
-
 Cameroon
-
 Canada
-
 Chile
-
 China
-
 Colombia
-
 Congo
-
 Costa Rica
-
 Cote d'Ivoire
-
 Croatia
-
 Cuba
-
 Cyprus
-
 Czechia
-
 DR Congo
-
 Denmark
-
 Dominican Republic
-
 Ecuador
-
 Egypt
-
 El Salvador
-
 Estonia
-
 Eswatini
-
 Ethiopia
-
 Finland
-
 France
-
 Georgia
-
 Germany
-
 Ghana
-
 Greece
-
 Haiti
-
 Hong Kong
-
 Hungary
-
 India
-
 Indonesia
-
 Iran, Islamic republic
-
 Iraq
-
 Ireland
-
 Israel
-
 Italy
-
 Jamaica
-
 Japan
-
 Jordan
-
 Kazakhstan
-
 Kenya
-
 Korea
-
 Kuwait
-
 Kyrgyzstan
-
 Laos
-
 Latvia
-
 Lebanon
-
 Lesotho
-
 Libya
-
 Lithuania
-
 Luxembourg
-
 Madagascar
-
 Malaysia
-
 Malta
-
 Mauritius
-
 Mexico
-
 Moldova
-
 Mongolia
-
 Montenegro
-
 Morocco
-
 Mozambique
-
 Myanmar
-
 Namibia
-
 Nepal
-
 Netherlands
-
 New Zealand
-
 Nigeria
-
 North Macedonia
-
 Norway
-
 Oman
-
 Pakistan
-
 Palestine
-
 Panama
-
 Papua New Guinea
-
 Paraguay
-
 Peru
-
 Philippines
-
 Poland
-
 Portugal
-
 Puerto Rico
-
 Qatar
-
 Reunion
-
 Romania
-
 Rwanda
-
 Saudi Arabia
-
 Serbia
-
 Singapore
-
 Slovakia
-
 Slovenia
-
 Somalia
-
 South Africa
-
 Spain
-
 Sri Lanka
-
 Sweden
-
 Switzerland
-
 Syria
-
 Taiwan
-
 Tajikistan
-
 Tanzania
-
 Thailand
-
 Trinidad and Tobago
-
 Tunisia
-
 Turkey
-
 UAE
-
 Uganda
-
 Ukraine
-
 United Kingdom
-
United States
-
 Uruguay
-
 Uzbekistan
-
 Venezuela
-
 Vietnam
-
 Yemen
-
 Zambia
-
 Zimbabwe
- Forex
- Crypto












