

Schlumberger stock outlook: Support test highlights downside risk

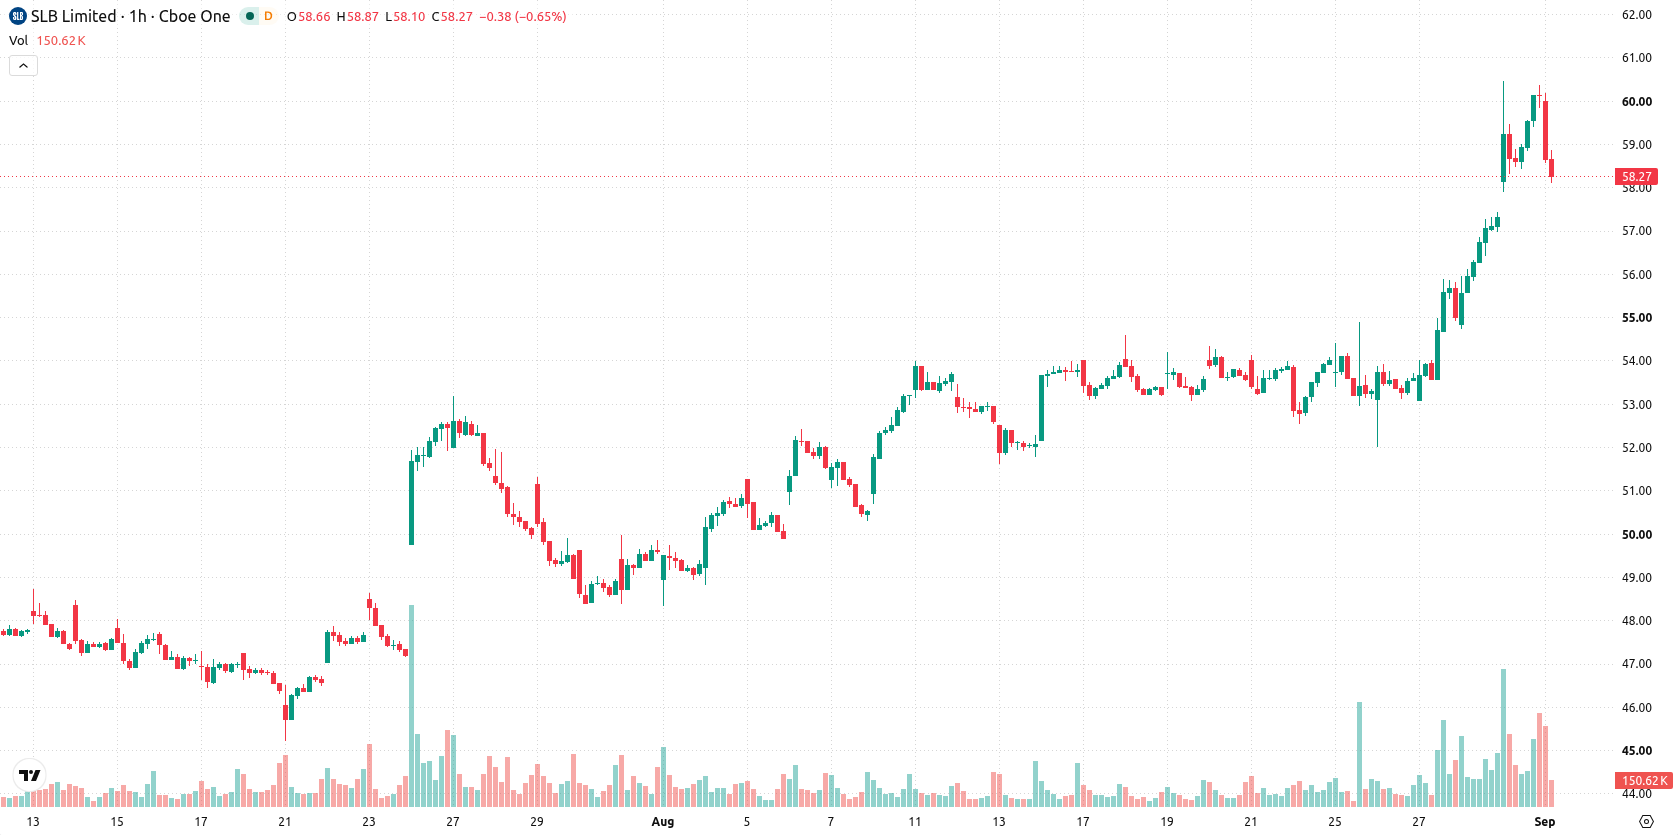
Schlumberger (SLB) stock is trading at $58.18, reflecting a daily decline of 3.23%. The price remains positioned above its key moving averages.
 48.23
51.22
Highlights
- Schlumberger entered an agreement to acquire Kelvion for $3.4 billion in cash and will assume $700 million in debt, aiming to grow in data center thermal management.
- Second quarter 2026 earnings for SLB exceeded expectations at $0.55 per share on $8.97 billion in revenue, but the stock has experienced ongoing selling pressure.
- Schlumberger stock trades with bullish momentum on multiple timeframes, but mixed indicators and a recent 3.23% pullback set its expected range at $54.48 to $61.88 over the next few days.
Acquisition and earnings beat drive sector expansion amid selling pressure
Schlumberger's recent definitive agreement to acquire Kelvion for $3.4 billion in cash and the assumption of $700 million in debt marks a significant move to expand its presence in the data center thermal management sector. This transaction, expected to close in the first half of 2027 pending regulatory clearance, reflects the company’s pursuit of medium-term business diversification. In addition, SLB's second quarter 2026 earnings exceeded analyst expectations with earnings of $0.55 per share on $8.97 billion in revenue, according to Investing.com and Finance Yahoo, demonstrating stronger-than-anticipated operational performance — though price action has remained under broader selling pressure.
Overbought signals emerge as momentum remains bullish above key supports
On the H1 chart, SLB is currently holding above the MA-20 at $57.01 and MA-50 at $54.92, and remains well above the long-term MA-200 at $48.63. The daily Ichimoku Kijun level at $56.77 is acting as immediate technical support. Momentum indicators show mixed signals: RSI is elevated at 80.53, while CCI and Stochastic RSI both indicate overbought conditions. MACD and ADX continue to issue bullish signals, and Bull/Bear Power highlights the prevailing dominance of intraday buyers. The Awesome Oscillator is currently neutral, reflecting a lack of additional trend confirmation.
Range-bound trade likely as breakout and breakdown risks diverge
In the short term, SLB is projected to trade within a volatility band ranging from $54.48 to $61.88 over the next two to three sessions. The probability of an upward move stands at 59%, with a less likely 41% chance of a downward move. Should the price remain range-bound, further consolidation is expected; a breakout above resistance would open room for additional gains, while a decisive move below immediate support would signal a bearish short-term scenario.
Earlier, analysts noted that Schlumberger maintained a bullish technical trend supported by stronger-than-expected earnings and its acquisition of Kelvion. The current technical setup adds a new dimension, as the stock trades above key moving averages with mixed momentum signals, making sustained consolidation or a breakout above the projected volatility range the primary scenarios to watch.






Latest Schlumberger News




-
 Afghanistan
-
 Albania
-
 Algeria
-
 Angola
-
 Argentina
-
 Armenia
-
 Australia
-
 Austria
-
 Azerbaijan
-
 Bahamas
-
 Bahrain
-
 Bangladesh
-
 Belarus
-
 Belgium
-
 Bolivia
-
 Botswana
-
 Brazil
-
 Brunei
-
 Bulgaria
-
 Cambodia
-
 Cameroon
-
 Canada
-
 Chile
-
 China
-
 Colombia
-
 Congo
-
 Costa Rica
-
 Cote d'Ivoire
-
 Croatia
-
 Cuba
-
 Cyprus
-
 Czechia
-
 DR Congo
-
 Denmark
-
 Dominican Republic
-
 Ecuador
-
 Egypt
-
 El Salvador
-
 Estonia
-
 Eswatini
-
 Ethiopia
-
 Finland
-
 France
-
 Georgia
-
 Germany
-
 Ghana
-
 Greece
-
 Haiti
-
 Hong Kong
-
 Hungary
-
 India
-
 Indonesia
-
 Iran, Islamic republic
-
 Iraq
-
 Ireland
-
 Israel
-
 Italy
-
 Jamaica
-
 Japan
-
 Jordan
-
 Kazakhstan
-
 Kenya
-
 Korea
-
 Kuwait
-
 Kyrgyzstan
-
 Laos
-
 Latvia
-
 Lebanon
-
 Lesotho
-
 Libya
-
 Lithuania
-
 Luxembourg
-
 Madagascar
-
 Malaysia
-
 Malta
-
 Mauritius
-
 Mexico
-
 Moldova
-
 Mongolia
-
 Montenegro
-
 Morocco
-
 Mozambique
-
 Myanmar
-
 Namibia
-
 Nepal
-
 Netherlands
-
 New Zealand
-
 Nigeria
-
 North Macedonia
-
 Norway
-
 Oman
-
 Pakistan
-
 Palestine
-
 Panama
-
 Papua New Guinea
-
 Paraguay
-
 Peru
-
 Philippines
-
 Poland
-
 Portugal
-
 Puerto Rico
-
 Qatar
-
 Reunion
-
 Romania
-
 Rwanda
-
 Saudi Arabia
-
 Serbia
-
 Singapore
-
 Slovakia
-
 Slovenia
-
 Somalia
-
 South Africa
-
 Spain
-
 Sri Lanka
-
 Sweden
-
 Switzerland
-
 Syria
-
 Taiwan
-
 Tajikistan
-
 Tanzania
-
 Thailand
-
 Trinidad and Tobago
-
 Tunisia
-
 Turkey
-
 UAE
-
 Uganda
-
 Ukraine
-
 United Kingdom
-
United States
-
 Uruguay
-
 Uzbekistan
-
 Venezuela
-
 Vietnam
-
 Yemen
-
 Zambia
-
 Zimbabwe
- Forex
- Crypto












