

Shell stock resistance test: Key levels to watch

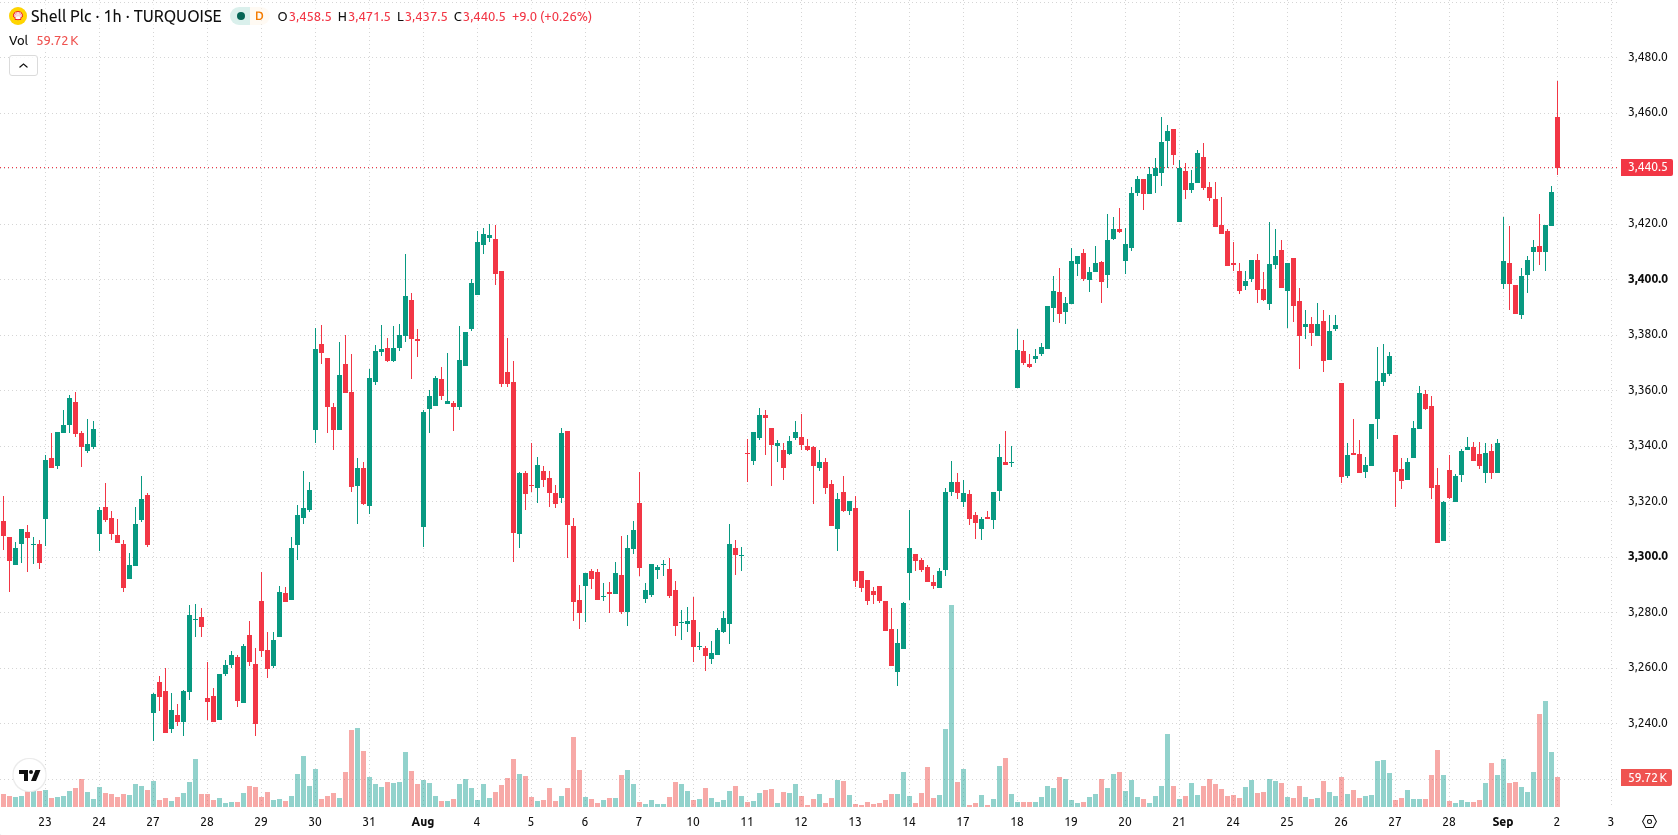
Shell (SHEL) stock is trading at GBX3,430, reflecting a daily gain of 2.69%. The price sits above its key moving averages on both hourly and daily timeframes, indicating continued momentum.
 3947.00
4035.50
Highlights
- Shell acquired Tri Star Energy, raising its stake in US company-owned convenience retail sites from 33% to 100%.
- Recent share buybacks and full cancellation of repurchased shares increase per-share valuation and clarify the share capital structure.
- Shares of Shell trade in a strong bullish trend near GBX3,430, expected to range between GBX3,372 to GBX3,487, with indicators signaling substantial buyer dominance but caution for short-term overbought conditions.
Retail expansion and buybacks drive higher demand and valuation
Shell's acquisition of Tri Star Energy, as reported by Prnewswire, increases its ownership in US company-owned convenience retail sites from 33% to 100%. This move immediately expands Shell's retail footprint in a key international market, catalyzing future revenue growth and providing direct support for share demand. In addition, the recent share buyback and full cancellation of repurchased shares, according to Globenewswire, mechanically enhance per-share valuation, while the updated share capital structure maintains transparency for equity holders.
Bullish conviction peaks as technicals flash overextension risk
On the technical front, the price trades above the MA-20 and MA-50 on the hourly chart and above the MA-200 on the daily chart. The Ichimoku Kijun sits at GBX3,369 and provides immediate support. Momentum indicators are robust, with a positive MACD and firm ADX, while the Awesome Oscillator also supports upward movement. Both RSI and Stoch RSI are in overbought territory, and continued buyer dominance is confirmed by CCI and Bull/Bear Power readings, suggesting a persistent, if possibly overextended, bullish bias.
Range-bound outlook as volatility and support thresholds shape risk
In the near term, Shell is likely to fluctuate within a volatility band of GBX3,372 to GBX3,487. The primary scenario sees sideways action within this range. If resistance gives way, the price could rally toward the upper target of the band, while a sustained drop below the Ichimoku Kijun at GBX3,369 would open the door to a corrective move lower.
Previously it was reported that Shell's ongoing buyback programme and corporate reshaping initiatives were supporting a positive technical backdrop for the shares. The addition of the Tri Star Energy acquisition and a mechanically strengthened per-share valuation bolster this view, with the main risk now centered on whether Shell maintains support at GBX3,369 amid a possible test of the current volatility band.











-
 Afghanistan
-
 Albania
-
 Algeria
-
 Angola
-
 Argentina
-
 Armenia
-
 Australia
-
 Austria
-
 Azerbaijan
-
 Bahamas
-
 Bahrain
-
 Bangladesh
-
 Belarus
-
 Belgium
-
 Bolivia
-
 Botswana
-
 Brazil
-
 Brunei
-
 Bulgaria
-
 Cambodia
-
 Cameroon
-
 Canada
-
 Chile
-
 China
-
 Colombia
-
 Congo
-
 Costa Rica
-
 Cote d'Ivoire
-
 Croatia
-
 Cuba
-
 Cyprus
-
 Czechia
-
 DR Congo
-
 Denmark
-
 Dominican Republic
-
 Ecuador
-
 Egypt
-
 El Salvador
-
 Estonia
-
 Eswatini
-
 Ethiopia
-
 Finland
-
 France
-
 Georgia
-
 Germany
-
 Ghana
-
 Greece
-
 Haiti
-
 Hong Kong
-
 Hungary
-
 India
-
 Indonesia
-
 Iran, Islamic republic
-
 Iraq
-
 Ireland
-
 Israel
-
 Italy
-
 Jamaica
-
 Japan
-
 Jordan
-
 Kazakhstan
-
 Kenya
-
 Korea
-
 Kuwait
-
 Kyrgyzstan
-
 Laos
-
 Latvia
-
 Lebanon
-
 Lesotho
-
 Libya
-
 Lithuania
-
 Luxembourg
-
 Madagascar
-
 Malaysia
-
 Malta
-
 Mauritius
-
 Mexico
-
 Moldova
-
 Mongolia
-
 Montenegro
-
 Morocco
-
 Mozambique
-
 Myanmar
-
 Namibia
-
 Nepal
-
 Netherlands
-
 New Zealand
-
 Nigeria
-
 North Macedonia
-
 Norway
-
 Oman
-
 Pakistan
-
 Palestine
-
 Panama
-
 Papua New Guinea
-
 Paraguay
-
 Peru
-
 Philippines
-
 Poland
-
 Portugal
-
 Puerto Rico
-
 Qatar
-
 Reunion
-
 Romania
-
 Rwanda
-
 Saudi Arabia
-
 Serbia
-
 Singapore
-
 Slovakia
-
 Slovenia
-
 Somalia
-
 South Africa
-
 Spain
-
 Sri Lanka
-
 Sweden
-
 Switzerland
-
 Syria
-
 Taiwan
-
 Tajikistan
-
 Tanzania
-
 Thailand
-
 Trinidad and Tobago
-
 Tunisia
-
 Turkey
-
 UAE
-
 Uganda
-
 Ukraine
-
 United Kingdom
-
United States
-
 Uruguay
-
 Uzbekistan
-
 Venezuela
-
 Vietnam
-
 Yemen
-
 Zambia
-
 Zimbabwe
- Forex
- Crypto












