


Best Buy Co. (BBY) surged 4.45% after posting stronger-than-expected Q2 earnings and raising its forward guidance, fueling renewed buying interest. The move is supported by the stock trading above its 20-day, 50-day, and 200-day simple moving averages, which confirm bullish momentum across all major timeframes.
 101.01
105.43
Highlights
- Best Buy reported Q2 earnings above expectations and raised its forward guidance for the upcoming period.
- The Computing segment continued to deliver steady growth, contributing to the overall performance.
- Shares of Best Buy are rangebound with support at $86.02 and resistance near $89.86, as technical signals offer mixed directionality.
Valuation stays firm amid guidance hike and segment strength
Best Buy reported Q2 earnings that exceeded expectations, prompting the company to lift its forward guidance. The Computing segment continued to show steady growth. BBY shares are viewed as reasonably valued based on current forward earnings multiples.
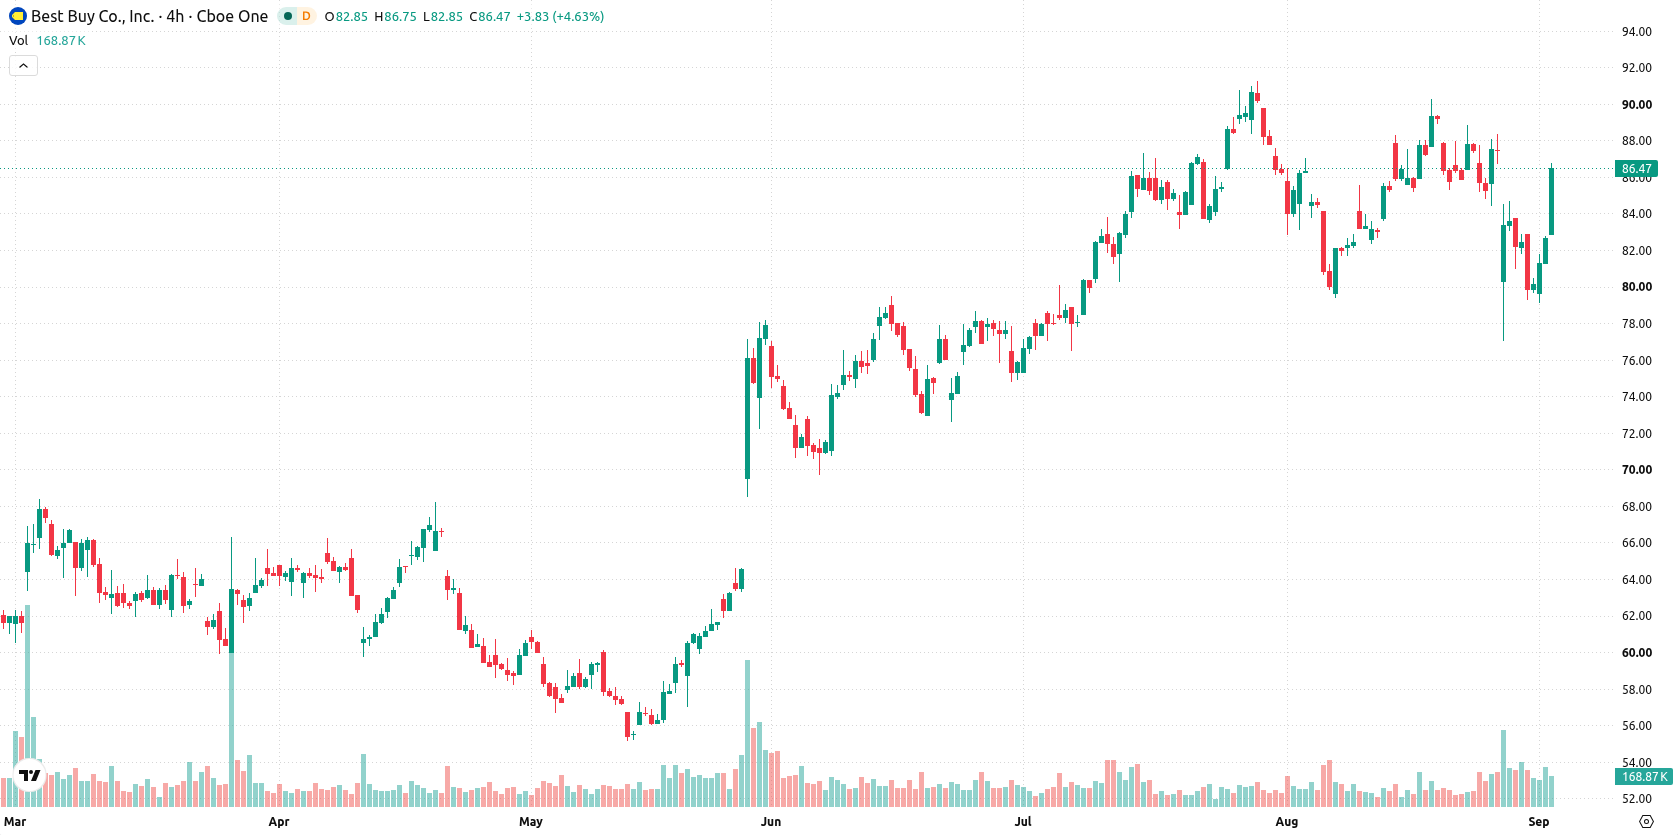
Conflicting technical signals as bullish trend meets oversold risk
Best Buy is trading above its 20-day, 50-day, and 200-day simple moving averages at $84.48, $83.32, and $71.28, respectively, confirming bullish momentum across short, medium, and long-term trends. The MA-50 vs MA-200 alignment is bullish, with support at $86.02 and resistance near $89.86. Momentum indicators show mixed signals: the Moving Average Convergence Divergence (MACD) and Average Directional Index (ADX) are both neutral, while the Relative Strength Index (RSI) and Commodity Channel Index (CCI) forecast a sell, both trending downward. The Stochastic RSI and Hull Moving Average (HMA) signal a strong buy, indicating the potential for a rebound from oversold conditions. Bull/Bear Power (BBP) is negative at -1.48, showing sellers are dominating intraday, and its "Oversold" call supports the idea of limited downside risk. The Awesome Oscillator (AO) is also in sell mode. The stock rose $3.68, or 4.45%, after opening with an upside gap of about $0.27 (0.33%) and is now trading near the day's high, which aligns with the stronger intraday tone. Intraday volatility stands at 3.76%. Several oscillators are bearish, while others suggest a potential bounce, highlighting divergence across tactical signals.
Earlier, analysts noted that despite ongoing innovation and long-term growth signals, Best Buy shares were under persistent short- and medium-term selling pressure. The current article signals a shift to broad-based bullish momentum with the stock trading above major moving averages, suggesting traders should monitor for a sustained break above $89.86 as a potential trigger for the next upside move.






Latest Best Buy Co News





-
 Afghanistan
-
 Albania
-
 Algeria
-
 Angola
-
 Argentina
-
 Armenia
-
 Australia
-
 Austria
-
 Azerbaijan
-
 Bahamas
-
 Bahrain
-
 Bangladesh
-
 Belarus
-
 Belgium
-
 Bolivia
-
 Botswana
-
 Brazil
-
 Brunei
-
 Bulgaria
-
 Cambodia
-
 Cameroon
-
 Canada
-
 Chile
-
 China
-
 Colombia
-
 Congo
-
 Costa Rica
-
 Cote d'Ivoire
-
 Croatia
-
 Cuba
-
 Cyprus
-
 Czechia
-
 DR Congo
-
 Denmark
-
 Dominican Republic
-
 Ecuador
-
 Egypt
-
 El Salvador
-
 Estonia
-
 Eswatini
-
 Ethiopia
-
 Finland
-
 France
-
 Georgia
-
 Germany
-
 Ghana
-
 Greece
-
 Haiti
-
 Hong Kong
-
 Hungary
-
 India
-
 Indonesia
-
 Iran, Islamic republic
-
 Iraq
-
 Ireland
-
 Israel
-
 Italy
-
 Jamaica
-
 Japan
-
 Jordan
-
 Kazakhstan
-
 Kenya
-
 Korea
-
 Kuwait
-
 Kyrgyzstan
-
 Laos
-
 Latvia
-
 Lebanon
-
 Lesotho
-
 Libya
-
 Lithuania
-
 Luxembourg
-
 Madagascar
-
 Malaysia
-
 Malta
-
 Mauritius
-
 Mexico
-
 Moldova
-
 Mongolia
-
 Montenegro
-
 Morocco
-
 Mozambique
-
 Myanmar
-
 Namibia
-
 Nepal
-
 Netherlands
-
 New Zealand
-
 Nigeria
-
 North Macedonia
-
 Norway
-
 Oman
-
 Pakistan
-
 Palestine
-
 Panama
-
 Papua New Guinea
-
 Paraguay
-
 Peru
-
 Philippines
-
 Poland
-
 Portugal
-
 Puerto Rico
-
 Qatar
-
 Reunion
-
 Romania
-
 Rwanda
-
 Saudi Arabia
-
 Serbia
-
 Singapore
-
 Slovakia
-
 Slovenia
-
 Somalia
-
 South Africa
-
 Spain
-
 Sri Lanka
-
 Sweden
-
 Switzerland
-
 Syria
-
 Taiwan
-
 Tajikistan
-
 Tanzania
-
 Thailand
-
 Trinidad and Tobago
-
 Tunisia
-
 Turkey
-
 UAE
-
 Uganda
-
 Ukraine
-
 United Kingdom
-
United States
-
 Uruguay
-
 Uzbekistan
-
 Venezuela
-
 Vietnam
-
 Yemen
-
 Zambia
-
 Zimbabwe
- Forex
- Crypto












