


Best Buy Co., Inc. (BBY) declined 3.34% after initial selling pressure accelerated, even as quarterly results highlighted momentum in new technology categories and omnichannel engagement. Persistent downward pressure is supported by the stock remaining below its 20-day and 50-day moving averages, with short- and medium-term trends limiting any recovery attempts.
 101.02
105.43
Highlights
- Best Buy reported Q2 2027 comparable sales above guidance and strong growth in AI glasses, trading cards, and health rings.
- Omnichannel engagement increased across in-store, digital channels, memberships, and services, with sustained gains from television innovations and mobile phone partnerships.
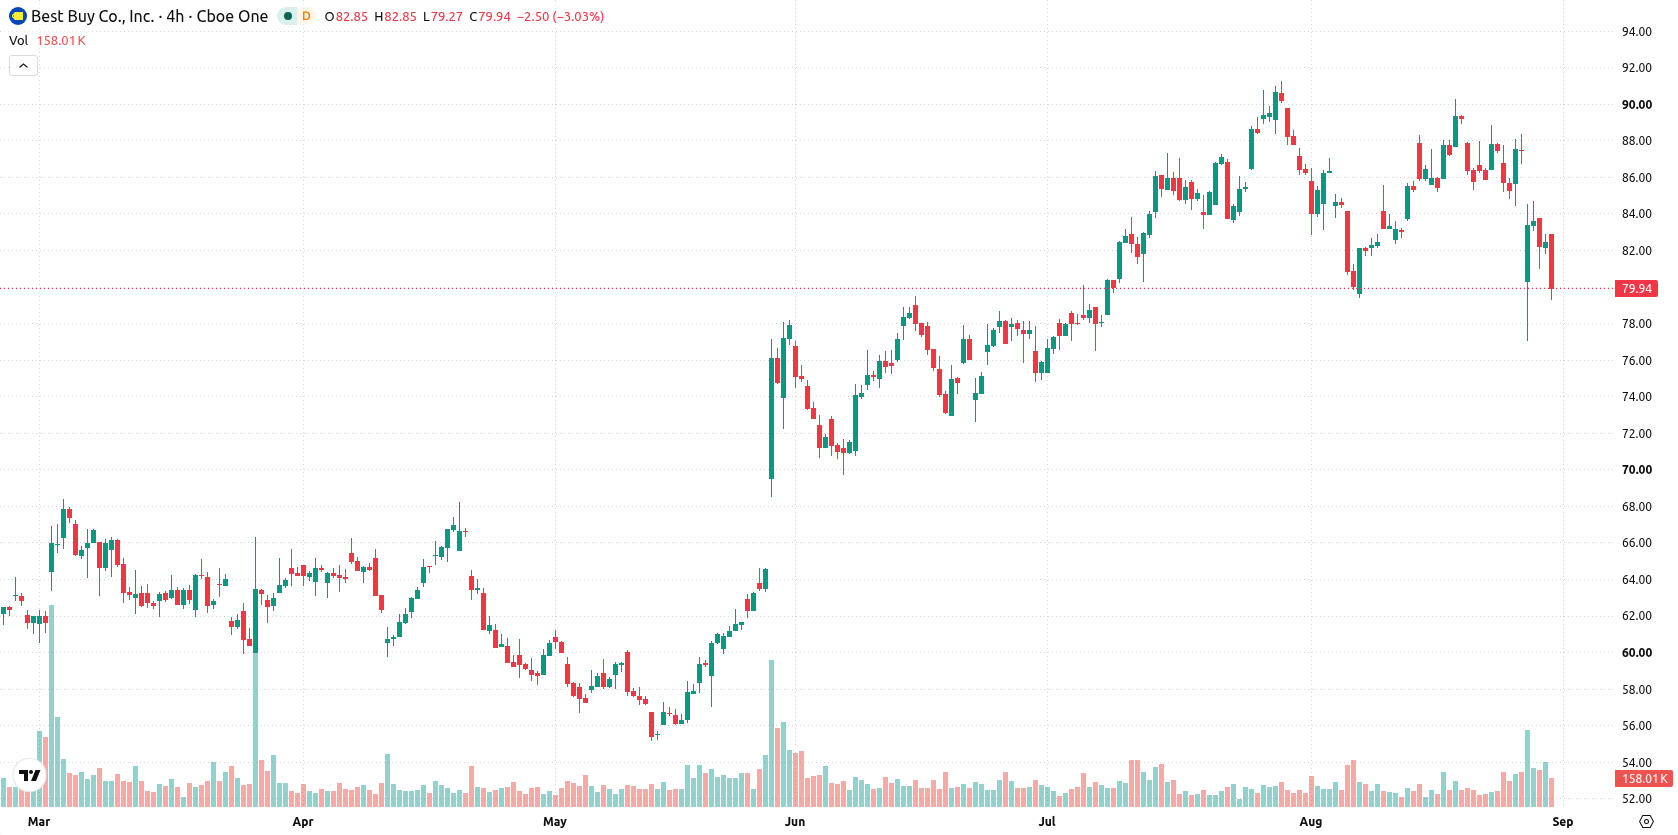
- Shares of Best Buy traded at $79.69 with persistent short- and medium-term downward pressure; key levels are support at $79.29, resistance at $82.08, and a projected five-day range of $74.25 to $85.13.
Earnings beat and tech innovation as selling pressure outweighs positive sentiment
Best Buy reported its Q2 2027 earnings, with comparable sales exceeding guidance and notable growth in emerging technology categories such as AI glasses, trading cards, and health rings. The company's omnichannel strategy recorded increased engagement across both in-store and digital platforms, including apps, memberships, and service offerings. Additional advances were observed through new innovations in the television business and continued growth in mobile phones due to expanded partnerships. These developments were highlighted in the earnings release, though price action has remained under broader selling pressure.
Mixed momentum signals as price stays below key averages and sellers dominate
Best Buy is trading below the 20-day ($84.92) and 50-day ($83.08) moving averages, but remains above the 200-day ($71.24) average, indicating persistent short- and medium-term downward pressure, with longer-term bullish structure intact. Immediate resistance is at the near-term ceiling of $82.08 and support at the near-term floor of $79.29. Momentum signals are mixed: Moving Average Convergence Divergence (MACD) shows a strong bullish bias, but the Average Directional Index (ADX) at 17.94 is neutral, and Relative Strength Index (RSI) as well as Commodity Channel Index (CCI) both produce sell readings. Stochastic RSI is at 0 and Bull/Bear Power (BBP) is negative at -1.23, so sellers dominate intraday action and both are oversold. The Awesome Oscillator (AO) also supports a bearish tone. The stock last traded at $79.69, down $2.75 or 3.34%, opening with a downside gap of $0.71 (0.86%) and currently trading near the day’s low with intraday volatility at 3.52%. Continued weakness after the open and the cluster of oversold signals suggest persistent selling pressure, although the bullish MACD reading highlights a lack of clear consensus.
Earlier, analysts noted that despite resilient long-term trends and upgraded guidance, Best Buy shares faced ongoing short- and medium-term selling pressure. The present analysis adds that intensified downside signals and persistent weakness now make the $79.29 support level a critical threshold for traders to monitor in the coming sessions.






Latest Best Buy Co News





-
 Afghanistan
-
 Albania
-
 Algeria
-
 Angola
-
 Argentina
-
 Armenia
-
 Australia
-
 Austria
-
 Azerbaijan
-
 Bahamas
-
 Bahrain
-
 Bangladesh
-
 Belarus
-
 Belgium
-
 Bolivia
-
 Botswana
-
 Brazil
-
 Brunei
-
 Bulgaria
-
 Cambodia
-
 Cameroon
-
 Canada
-
 Chile
-
 China
-
 Colombia
-
 Congo
-
 Costa Rica
-
 Cote d'Ivoire
-
 Croatia
-
 Cuba
-
 Cyprus
-
 Czechia
-
 DR Congo
-
 Denmark
-
 Dominican Republic
-
 Ecuador
-
 Egypt
-
 El Salvador
-
 Estonia
-
 Eswatini
-
 Ethiopia
-
 Finland
-
 France
-
 Georgia
-
 Germany
-
 Ghana
-
 Greece
-
 Haiti
-
 Hong Kong
-
 Hungary
-
 India
-
 Indonesia
-
 Iran, Islamic republic
-
 Iraq
-
 Ireland
-
 Israel
-
 Italy
-
 Jamaica
-
 Japan
-
 Jordan
-
 Kazakhstan
-
 Kenya
-
 Korea
-
 Kuwait
-
 Kyrgyzstan
-
 Laos
-
 Latvia
-
 Lebanon
-
 Lesotho
-
 Libya
-
 Lithuania
-
 Luxembourg
-
 Madagascar
-
 Malaysia
-
 Malta
-
 Mauritius
-
 Mexico
-
 Moldova
-
 Mongolia
-
 Montenegro
-
 Morocco
-
 Mozambique
-
 Myanmar
-
 Namibia
-
 Nepal
-
 Netherlands
-
 New Zealand
-
 Nigeria
-
 North Macedonia
-
 Norway
-
 Oman
-
 Pakistan
-
 Palestine
-
 Panama
-
 Papua New Guinea
-
 Paraguay
-
 Peru
-
 Philippines
-
 Poland
-
 Portugal
-
 Puerto Rico
-
 Qatar
-
 Reunion
-
 Romania
-
 Rwanda
-
 Saudi Arabia
-
 Serbia
-
 Singapore
-
 Slovakia
-
 Slovenia
-
 Somalia
-
 South Africa
-
 Spain
-
 Sri Lanka
-
 Sweden
-
 Switzerland
-
 Syria
-
 Taiwan
-
 Tajikistan
-
 Tanzania
-
 Thailand
-
 Trinidad and Tobago
-
 Tunisia
-
 Turkey
-
 UAE
-
 Uganda
-
 Ukraine
-
 United Kingdom
-
United States
-
 Uruguay
-
 Uzbekistan
-
 Venezuela
-
 Vietnam
-
 Yemen
-
 Zambia
-
 Zimbabwe
- Forex
- Crypto












