

BBY slides as weak momentum weighs on price action

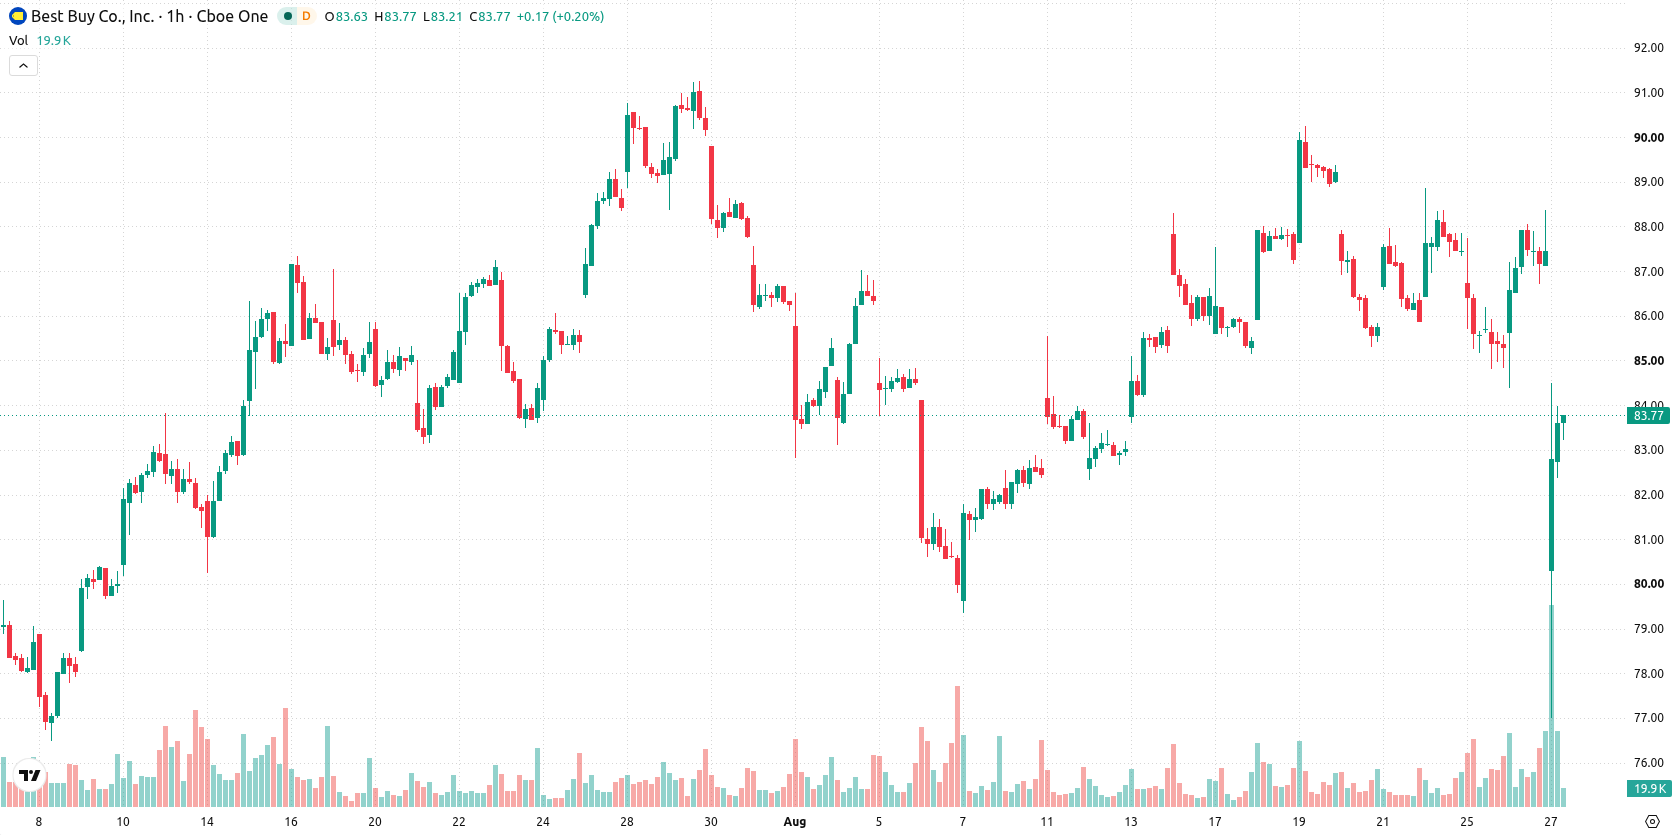
Best Buy (BBY) stock is trading at $83.64, marking a daily decline of 4.35%. The stock currently sits below its short- and mid-term moving averages, yet remains above its long-term trend indicators.
 98.66
100.45
Highlights
- Best Buy stock topped expectations with adjusted earnings per share of $1.47 and revenue of $9.78 billion for the quarter.
- Management raised full-year 2027 revenue and earnings guidance and saw comparable sales rise 4.1% with a temporary margin gain from tariff refunds.
- Shares slipped 4.35% to $83.64 amid technical signals of short- and mid-term selling, with an expected trading range of $81.63 to $85.65 likely to hold in the near term.
Upbeat outlook and margin lift contrast with persistent selling pressure
Best Buy recorded stronger-than-expected second quarter results, reporting adjusted earnings per share of $1.47 and revenue of $9.78 billion according to Cnbc, both surpassing analyst forecasts and reflecting robust recent operations. The company also lifted its revenue and earnings guidance for the full fiscal year 2027, signaling management's confidence in forward demand and profitability targets, per CNBC. Quarterly growth was further supported by a 4.1% year-over-year increase in comparable store sales and a temporary margin boost from a $34 million tariff refund, though price action has remained under broader selling pressure.
Divergent buy signals as overbought oscillators clash with flat momentum
On the technical side, BBY/USD is trading beneath the MA-20 and MA-50 on the working timeframe, but remains above the longer-term MA-200 at $71.2. Immediate resistance is noted at the Ichimoku Kijun level of $86.63. The RSI stands at 55.3, indicating a buy condition, while MACD and ADX remain neutral, reflecting only moderate trend conviction. Stoch RSI, CCI, and Awesome Oscillator all show buy signals, yet Bull/Bear Power is overbought, which points to buyer dominance during intraday moves. This divergence between overbought oscillators and neutral momentum comes as daily losses have not fully aligned with ongoing short-term buying signals or the intraday recovery.
Downside bias dominates as volatility bands frame short-term trading
In the short term, BBY/USD is expected to consolidate within the $81.63 to $85.65 range, which represents a volatility band relative to current levels. The scenario analysis suggests a 78% probability of further downside, with only a 22% chance of a breakout to the upside. The baseline expectation is for a continuation of sideways trading near the lower end of the recent range, while violations of support or resistance could trigger either a bearish move below the projected band or a push higher if immediate resistance is cleared.
Previously it was reported that Best Buy’s medium-term outlook remained bullish despite ongoing selling pressure following stronger-than-expected performance and upgraded guidance. The current market setup adds nuance to this view, as ongoing volatility and mixed momentum suggest traders should closely monitor the $81.63 support zone for signals of renewed directional movement.






Latest Best Buy Co News





-
 Afghanistan
-
 Albania
-
 Algeria
-
 Angola
-
 Argentina
-
 Armenia
-
 Australia
-
 Austria
-
 Azerbaijan
-
 Bahamas
-
 Bahrain
-
 Bangladesh
-
 Belarus
-
 Belgium
-
 Bolivia
-
 Botswana
-
 Brazil
-
 Brunei
-
 Bulgaria
-
 Cambodia
-
 Cameroon
-
 Canada
-
 Chile
-
 China
-
 Colombia
-
 Congo
-
 Costa Rica
-
 Cote d'Ivoire
-
 Croatia
-
 Cuba
-
 Cyprus
-
 Czechia
-
 DR Congo
-
 Denmark
-
 Dominican Republic
-
 Ecuador
-
 Egypt
-
 El Salvador
-
 Estonia
-
 Eswatini
-
 Ethiopia
-
 Finland
-
 France
-
 Georgia
-
 Germany
-
 Ghana
-
 Greece
-
 Haiti
-
 Hong Kong
-
 Hungary
-
 India
-
 Indonesia
-
 Iran, Islamic republic
-
 Iraq
-
 Ireland
-
 Israel
-
 Italy
-
 Jamaica
-
 Japan
-
 Jordan
-
 Kazakhstan
-
 Kenya
-
 Korea
-
 Kuwait
-
 Kyrgyzstan
-
 Laos
-
 Latvia
-
 Lebanon
-
 Lesotho
-
 Libya
-
 Lithuania
-
 Luxembourg
-
 Madagascar
-
 Malaysia
-
 Malta
-
 Mauritius
-
 Mexico
-
 Moldova
-
 Mongolia
-
 Montenegro
-
 Morocco
-
 Mozambique
-
 Myanmar
-
 Namibia
-
 Nepal
-
 Netherlands
-
 New Zealand
-
 Nigeria
-
 North Macedonia
-
 Norway
-
 Oman
-
 Pakistan
-
 Palestine
-
 Panama
-
 Papua New Guinea
-
 Paraguay
-
 Peru
-
 Philippines
-
 Poland
-
 Portugal
-
 Puerto Rico
-
 Qatar
-
 Reunion
-
 Romania
-
 Rwanda
-
 Saudi Arabia
-
 Serbia
-
 Singapore
-
 Slovakia
-
 Slovenia
-
 Somalia
-
 South Africa
-
 Spain
-
 Sri Lanka
-
 Sweden
-
 Switzerland
-
 Syria
-
 Taiwan
-
 Tajikistan
-
 Tanzania
-
 Thailand
-
 Trinidad and Tobago
-
 Tunisia
-
 Turkey
-
 UAE
-
 Uganda
-
 Ukraine
-
 United Kingdom
-
United States
-
 Uruguay
-
 Uzbekistan
-
 Venezuela
-
 Vietnam
-
 Yemen
-
 Zambia
-
 Zimbabwe
- Forex
- Crypto












