

McDonald's stock weekly forecast: Continued weakness persists with momentum indicators firmly oversold

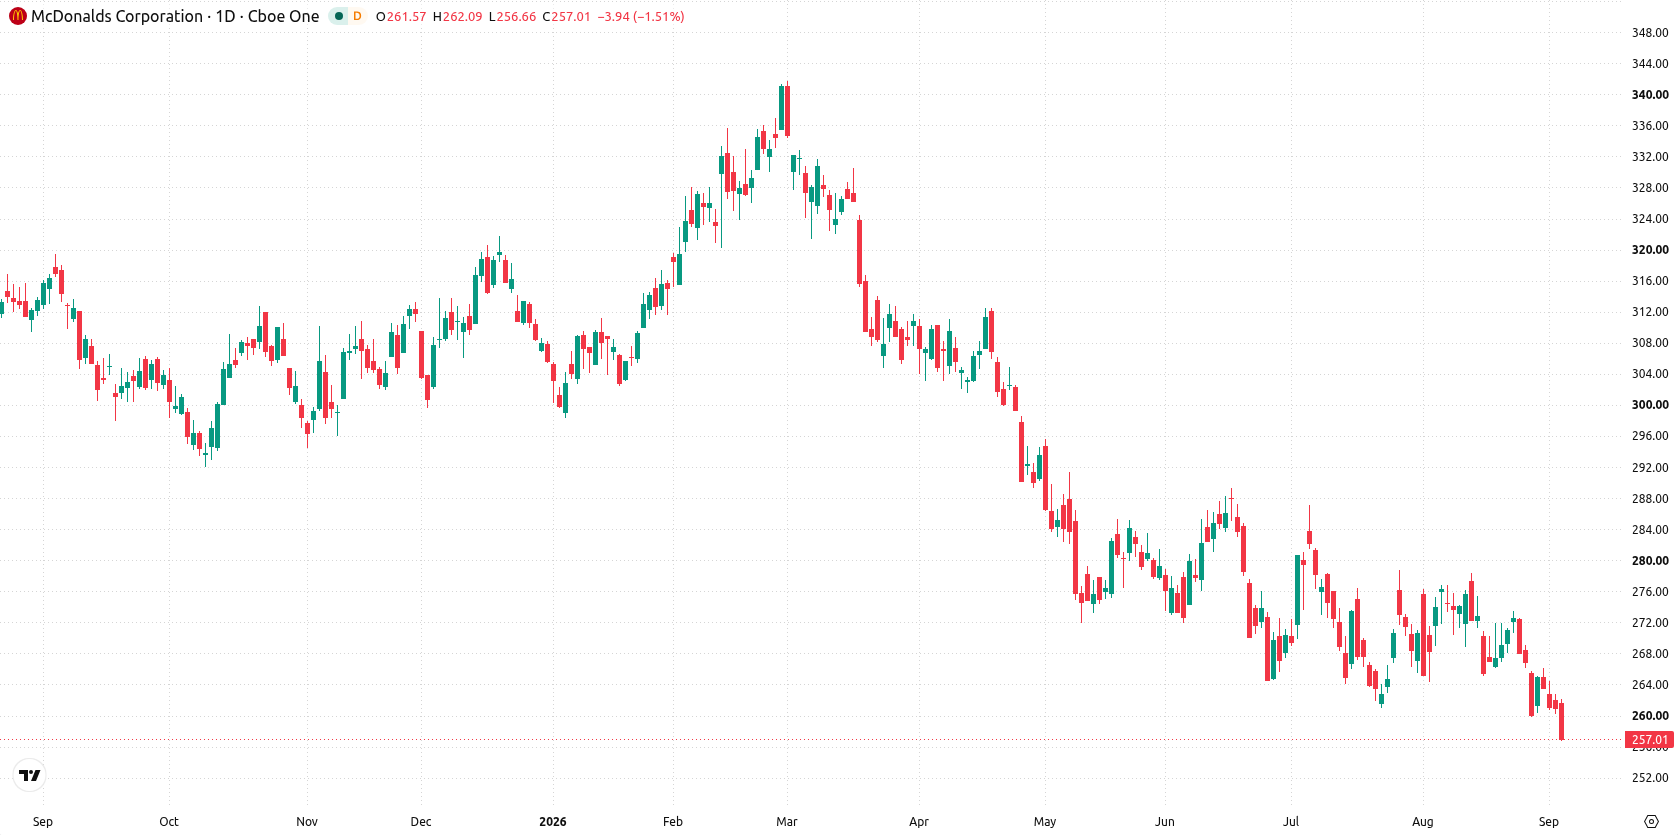
Shares of McDonald's Corporation (MCD) are trading near $256 after slipping over 1.5% this week, as sellers maintained pressure and the setup remains firmly in oversold territory. Continued concerns around affordability and competitive headwinds kept the stock pinned around its lows, setting a cautious tone for the week ahead.
 259.67
257.65
Highlights
- Shares of McDonald's fell 1.59% over the past week to $256.48, closing at the lower end of their recent range.
- Technical indicators remain bearish, with the stock trading below key moving averages and showing oversold momentum readings.
- Price action is expected to stay between $253.73 and $259.22, with a 78% probability of further decline.
Dividend hike and menu revival offset by institutional outflows this week
McDonald's announced a 5.1% increase to its quarterly dividend, lifting it to $1.86 per share and marking its 26th consecutive year of dividend hikes, according to 24/7 Wall St. Institutional investors including NS Partners Ltd and Cullinan Associates Inc. trimmed positions in MCD in the second quarter, as reported by MarketBeat and The Markets Daily. The company's decision to bring back Spicy Chicken McNuggets nationwide on September 1, 2026, as reported by GuruFocus, reflects ongoing efforts to boost traffic amid challenging quick-service conditions.
Bearish momentum deepens as CCI and stochastic RSI remain oversold
On the daily chart, the setup reflects persistent selling pressure as the stock posts a contained move within a narrow range and volatility came in at 2.36% for the week. Momentum indicators are decisively bearish, with CCI deep in the oversold zone at -138.8 and Stochastic RSI also displaying an oversold reading. MACD remains in sell territory, matching the stock’s position below major moving averages. Immediate resistance sits at $259.88, while the Ichimoku Kijun at $269.12 presents a higher barrier if an upward move emerges.
Consolidation bias remains as downside risks dominate forecast for next week
In the week ahead, price action is expected to remain between $253.73 and $259.22, with a 22% probability of an increase and a 78% chance of decline. The base case is for the stock to consolidate within this range, anchored by recent weakness. A move above $259.88 could expose the upper end of the expected range and test the Kijun resistance, while a break below $253.73 would reinforce the bearish momentum and open further downside risk.
Earlier, analysts noted that McDonald's faced sustained technical weakness and downside momentum despite operational initiatives. The current article strengthens this view, with fresh oversold readings and bearish signals further highlighting $259.88 as the critical resistance level to monitor for any potential shift in trend.






Latest McDonald’s News



-
 Afghanistan
-
 Albania
-
 Algeria
-
 Angola
-
 Argentina
-
 Armenia
-
 Australia
-
 Austria
-
 Azerbaijan
-
 Bahamas
-
 Bahrain
-
 Bangladesh
-
 Belarus
-
 Belgium
-
 Bolivia
-
 Botswana
-
 Brazil
-
 Brunei
-
 Bulgaria
-
 Cambodia
-
 Cameroon
-
 Canada
-
 Chile
-
 China
-
 Colombia
-
 Congo
-
 Costa Rica
-
 Cote d'Ivoire
-
 Croatia
-
 Cuba
-
 Cyprus
-
 Czechia
-
 DR Congo
-
 Denmark
-
 Dominican Republic
-
 Ecuador
-
 Egypt
-
 El Salvador
-
 Estonia
-
 Eswatini
-
 Ethiopia
-
 Finland
-
 France
-
 Georgia
-
 Germany
-
 Ghana
-
 Greece
-
 Haiti
-
 Hong Kong
-
 Hungary
-
 India
-
 Indonesia
-
 Iran, Islamic republic
-
 Iraq
-
 Ireland
-
 Israel
-
 Italy
-
 Jamaica
-
 Japan
-
 Jordan
-
 Kazakhstan
-
 Kenya
-
 Korea
-
 Kuwait
-
 Kyrgyzstan
-
 Laos
-
 Latvia
-
 Lebanon
-
 Lesotho
-
 Libya
-
 Lithuania
-
 Luxembourg
-
 Madagascar
-
 Malaysia
-
 Malta
-
 Mauritius
-
 Mexico
-
 Moldova
-
 Mongolia
-
 Montenegro
-
 Morocco
-
 Mozambique
-
 Myanmar
-
 Namibia
-
 Nepal
-
 Netherlands
-
 New Zealand
-
 Nigeria
-
 North Macedonia
-
 Norway
-
 Oman
-
 Pakistan
-
 Palestine
-
 Panama
-
 Papua New Guinea
-
 Paraguay
-
 Peru
-
 Philippines
-
 Poland
-
 Portugal
-
 Puerto Rico
-
 Qatar
-
 Reunion
-
 Romania
-
 Rwanda
-
 Saudi Arabia
-
 Serbia
-
 Singapore
-
 Slovakia
-
 Slovenia
-
 Somalia
-
 South Africa
-
 Spain
-
 Sri Lanka
-
 Sweden
-
 Switzerland
-
 Syria
-
 Taiwan
-
 Tajikistan
-
 Tanzania
-
 Thailand
-
 Trinidad and Tobago
-
 Tunisia
-
 Turkey
-
 UAE
-
 Uganda
-
 Ukraine
-
 United Kingdom
-
United States
-
 Uruguay
-
 Uzbekistan
-
 Venezuela
-
 Vietnam
-
 Yemen
-
 Zambia
-
 Zimbabwe
- Forex
- Crypto












