

SoFi stock forecast: Breakout attempt at $19.35 resistance

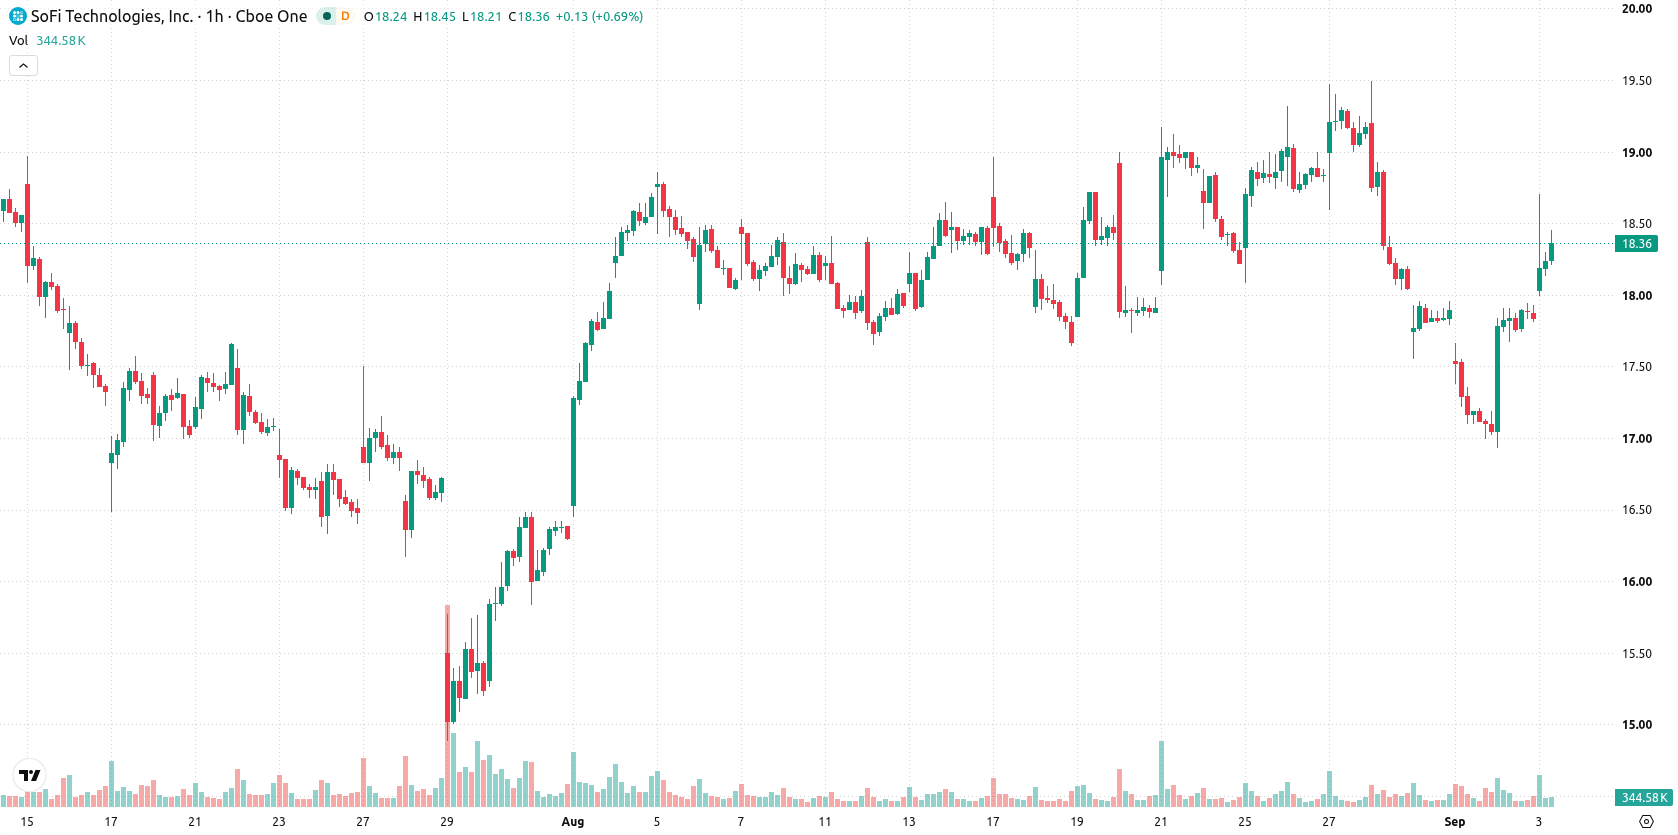
SoFi Technologies, Inc. (SOFI) stock is trading at $18.41, up 3.17% on the day. The price is currently positioned above its key short- and medium-term moving averages, while remaining below its longer-term average.
 17.60
17.63
Highlights
- SoFi Technologies and Kraken parent Payward have partnered to link SoFi's banking settlement system to Kraken's digital-asset infrastructure.
- The arrangement allows Payward to join the SoFi Exchange Network and list SoFiUSD on Kraken, expanding SoFiUSD's presence and transaction volume.
- SoFi stock advanced 3.17% to $18.41 with strong short-term bullish momentum, trading in an expected $17.47 to $19.35 range over the next several days.
Transaction volume and asset reach grow as SoFi, Kraken partner
SoFi Technologies and Payward, the parent company of Kraken, have formed a partnership to link SoFi's banking settlement network with Kraken's digital-asset infrastructure, according to Theblock. This deal enables Payward to join the SoFi Exchange Network and list SoFiUSD on Kraken, while also giving SoFi access to additional digital-asset liquidity through Kraken Prime. The linkage expands SoFi's settlement and digital-asset capabilities, directly increasing transactional volume and broadening SoFiUSD's presence in the digital-asset ecosystem.
Intraday buying prevails as overbought signals converge with resistance
On the hourly chart, SOFI is trading above the MA-20 at $17.65 and MA-50 at $18.29, but remains below the long-term MA-200 at $20.06 on the daily chart. The Ichimoku Kijun level at $17.81 acts as immediate support. ADX and RSI (60.2) suggest intraday buying momentum, and Bull/Bear Power indicates buyers are currently dominant. However, Stochastic RSI and CCI are signaling overbought conditions, and MACD remains Neutral. The Awesome Oscillator shows a strong buy signal, further confirming the active upward momentum.
Upside breakout likely as trading band narrows
Over the next 2 to 3 trading days, SOFI is expected to trade within a range of $17.47 to $19.35, with a high probability of further upside movement and a low probability of a downside move. The baseline scenario calls for SOFI consolidating within this band, but a breakout above $19.35 would set up a bullish extension. If price falls below the $17.47 support, a bearish scenario may develop.
Earlier, analysts noted that SoFi stock was consolidating with downside risks prevailing amid mixed technical momentum, despite ongoing growth initiatives. The new partnership with Kraken broadens SoFi's digital-asset exposure and sets the stage for traders to watch for a potential breakout above $19.35 as the next bullish trigger.










-
 Afghanistan
-
 Albania
-
 Algeria
-
 Angola
-
 Argentina
-
 Armenia
-
 Australia
-
 Austria
-
 Azerbaijan
-
 Bahamas
-
 Bahrain
-
 Bangladesh
-
 Belarus
-
 Belgium
-
 Bolivia
-
 Botswana
-
 Brazil
-
 Brunei
-
 Bulgaria
-
 Cambodia
-
 Cameroon
-
 Canada
-
 Chile
-
 China
-
 Colombia
-
 Congo
-
 Costa Rica
-
 Cote d'Ivoire
-
 Croatia
-
 Cuba
-
 Cyprus
-
 Czechia
-
 DR Congo
-
 Denmark
-
 Dominican Republic
-
 Ecuador
-
 Egypt
-
 El Salvador
-
 Estonia
-
 Eswatini
-
 Ethiopia
-
 Finland
-
 France
-
 Georgia
-
 Germany
-
 Ghana
-
 Greece
-
 Haiti
-
 Hong Kong
-
 Hungary
-
 India
-
 Indonesia
-
 Iran, Islamic republic
-
 Iraq
-
 Ireland
-
 Israel
-
 Italy
-
 Jamaica
-
 Japan
-
 Jordan
-
 Kazakhstan
-
 Kenya
-
 Korea
-
 Kuwait
-
 Kyrgyzstan
-
 Laos
-
 Latvia
-
 Lebanon
-
 Lesotho
-
 Libya
-
 Lithuania
-
 Luxembourg
-
 Madagascar
-
 Malaysia
-
 Malta
-
 Mauritius
-
 Mexico
-
 Moldova
-
 Mongolia
-
 Montenegro
-
 Morocco
-
 Mozambique
-
 Myanmar
-
 Namibia
-
 Nepal
-
 Netherlands
-
 New Zealand
-
 Nigeria
-
 North Macedonia
-
 Norway
-
 Oman
-
 Pakistan
-
 Palestine
-
 Panama
-
 Papua New Guinea
-
 Paraguay
-
 Peru
-
 Philippines
-
 Poland
-
 Portugal
-
 Puerto Rico
-
 Qatar
-
 Reunion
-
 Romania
-
 Rwanda
-
 Saudi Arabia
-
 Serbia
-
 Singapore
-
 Slovakia
-
 Slovenia
-
 Somalia
-
 South Africa
-
 Spain
-
 Sri Lanka
-
 Sweden
-
 Switzerland
-
 Syria
-
 Taiwan
-
 Tajikistan
-
 Tanzania
-
 Thailand
-
 Trinidad and Tobago
-
 Tunisia
-
 Turkey
-
 UAE
-
 Uganda
-
 Ukraine
-
 United Kingdom
-
United States
-
 Uruguay
-
 Uzbekistan
-
 Venezuela
-
 Vietnam
-
 Yemen
-
 Zambia
-
 Zimbabwe
- Forex
- Crypto












