

Can Nano Dimension stock sustain rebound as long-term trend shows strength?

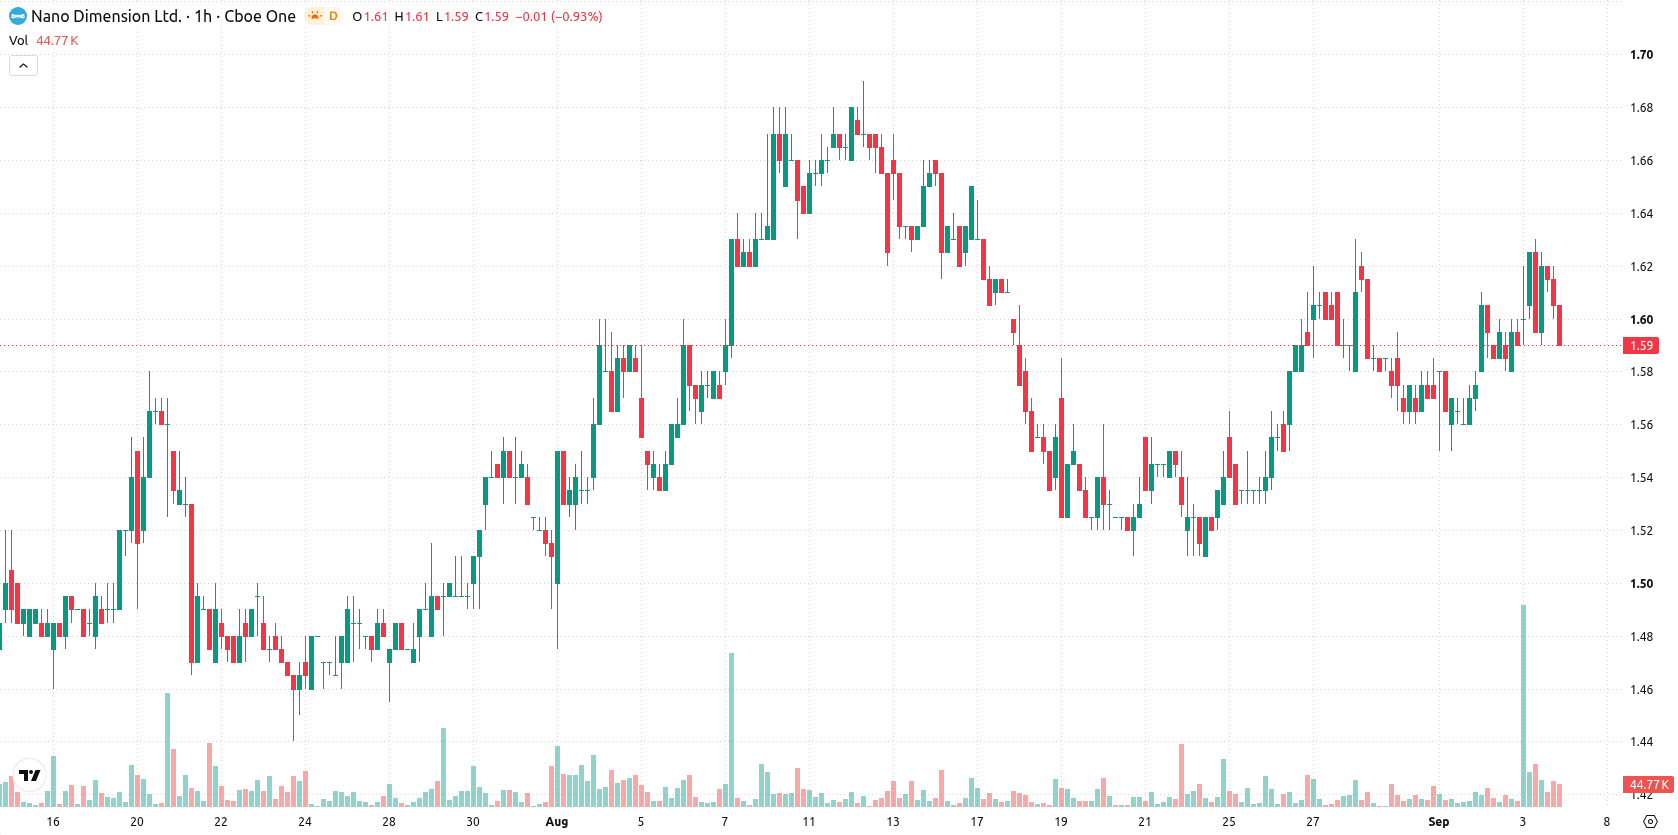
Nano Dimension (NNDM) stock is trading at $1.6, up 1.27% on the day. The price sits above its short- and medium-term moving averages, but remains below the longer-term trend as indicated by major averages.
 1.39
1.45
Highlights
- NNDM/USD trades with short- and medium-term bullish momentum but remains in a longer-term bearish setup.
- Momentum signals are mixed with bullish MACD, neutral ADX, and oscillators diverging as price gains 1.27 percent but closes near session low.
- Over the next 2 to 3 days, price is expected to stay within $1.56 to $1.64 with 74 percent up probability and sideways as the base scenario.
Bullish momentum diverges from neutral ADX as upside stalls
On the technical front, NNDM is trading above its MA-20 and MA-50 on the hourly chart, while remaining below the MA-200 on the daily chart. The Ichimoku Kijun at $1.59 is acting as immediate support for price action. Among momentum indicators, MACD is giving a buy signal and Bull/Bear Power reflects buyer dominance on an intraday basis, but ADX is neutral, calling trend strength into question. RSI sits near a neutral 51.75 but leans bullish, Stochastic RSI is oversold, CCI is neutral, and the Awesome Oscillator also provides a neutral reading. There is a noticeable divergence between short-term bullish signals and the price stalling near the session low.
Sideways bias as breakout odds outweigh downside risk
Looking ahead to the next 2–3 trading days, the price is forecast to move within a $1.56 to $1.64 corridor, reflecting typical volatility relative to current levels. The up probability is 74%, making a downside move much less likely in the near term. The baseline expectation is for sideways trading within this range; a decisive breakout above resistance may bring further gains, while a fall below immediate support would increase short-term bearish risk.
Earlier, analysts noted that Nano Dimension’s price action was characterized by indecision and a broadly sideways trend amid mixed technical signals. The latest analysis strengthens this view, as a confluence of near-term bullish signals and neutral trend indicators suggests traders should closely monitor the $1.64 resistance level for confirmation of any breakout.










-
 Afghanistan
-
 Albania
-
 Algeria
-
 Angola
-
 Argentina
-
 Armenia
-
 Australia
-
 Austria
-
 Azerbaijan
-
 Bahamas
-
 Bahrain
-
 Bangladesh
-
 Belarus
-
 Belgium
-
 Bolivia
-
 Botswana
-
 Brazil
-
 Brunei
-
 Bulgaria
-
 Cambodia
-
 Cameroon
-
 Canada
-
 Chile
-
 China
-
 Colombia
-
 Congo
-
 Costa Rica
-
 Cote d'Ivoire
-
 Croatia
-
 Cuba
-
 Cyprus
-
 Czechia
-
 DR Congo
-
 Denmark
-
 Dominican Republic
-
 Ecuador
-
 Egypt
-
 El Salvador
-
 Estonia
-
 Eswatini
-
 Ethiopia
-
 Finland
-
 France
-
 Georgia
-
 Germany
-
 Ghana
-
 Greece
-
 Haiti
-
 Hong Kong
-
 Hungary
-
 India
-
 Indonesia
-
 Iran, Islamic republic
-
 Iraq
-
 Ireland
-
 Israel
-
 Italy
-
 Jamaica
-
 Japan
-
 Jordan
-
 Kazakhstan
-
 Kenya
-
 Korea
-
 Kuwait
-
 Kyrgyzstan
-
 Laos
-
 Latvia
-
 Lebanon
-
 Lesotho
-
 Libya
-
 Lithuania
-
 Luxembourg
-
 Madagascar
-
 Malaysia
-
 Malta
-
 Mauritius
-
 Mexico
-
 Moldova
-
 Mongolia
-
 Montenegro
-
 Morocco
-
 Mozambique
-
 Myanmar
-
 Namibia
-
 Nepal
-
 Netherlands
-
 New Zealand
-
 Nigeria
-
 North Macedonia
-
 Norway
-
 Oman
-
 Pakistan
-
 Palestine
-
 Panama
-
 Papua New Guinea
-
 Paraguay
-
 Peru
-
 Philippines
-
 Poland
-
 Portugal
-
 Puerto Rico
-
 Qatar
-
 Reunion
-
 Romania
-
 Rwanda
-
 Saudi Arabia
-
 Serbia
-
 Singapore
-
 Slovakia
-
 Slovenia
-
 Somalia
-
 South Africa
-
 Spain
-
 Sri Lanka
-
 Sweden
-
 Switzerland
-
 Syria
-
 Taiwan
-
 Tajikistan
-
 Tanzania
-
 Thailand
-
 Trinidad and Tobago
-
 Tunisia
-
 Turkey
-
 UAE
-
 Uganda
-
 Ukraine
-
 United Kingdom
-
United States
-
 Uruguay
-
 Uzbekistan
-
 Venezuela
-
 Vietnam
-
 Yemen
-
 Zambia
-
 Zimbabwe
- Forex
- Crypto












