

INTU slides nearly 3% as price action reflects renewed seller pressure despite upbeat FY26 earnings

Intuit Inc. (INTU) fell 2.92% after reporting robust fiscal year 2026 results, including a strong fourth quarter, a higher dividend, and a major share buyback authorization, even as securities fraud lawsuits and acknowledged competitive pressures in the tax segment weighed on sentiment. The downside is reinforced, with the stock trading below its 20-day and 200-day moving averages but holding above the 50-day average, highlighting persistent seller pressure offset by some medium-term support.
 332.03
351.38
Highlights
- Intuit reported fiscal 2026 revenue of $21.4 billion and non-GAAP diluted EPS of $24.27, surpassing consensus estimates.
- The company raised its dividend by 15 percent, approved a $7.9 billion share buyback, and detailed new AI-driven initiatives alongside ongoing legal and competitive challenges.
- Shares of Intuit trade under short-term and long-term moving averages with mixed momentum signals, expected to range between $322.78 and $344.6 in the next five days.
Investor focus shifts to buyback and AI pivot amid litigation risks
Intuit Inc. reported fiscal year 2026 revenue of $21.4 billion and non-GAAP diluted EPS of $24.27. Fourth-quarter revenue increased 13.7% year over year, and EPS surpassed consensus estimates. The company increased its dividend by 15%, authorized a $7.9 billion share buyback, and announced strategic investments, including new AI-powered offerings and a shift toward more assisted solutions. Ongoing securities fraud class action lawsuits and increasing competitive and pricing pressures in the tax segment were acknowledged, though price action has remained under broader selling pressure.
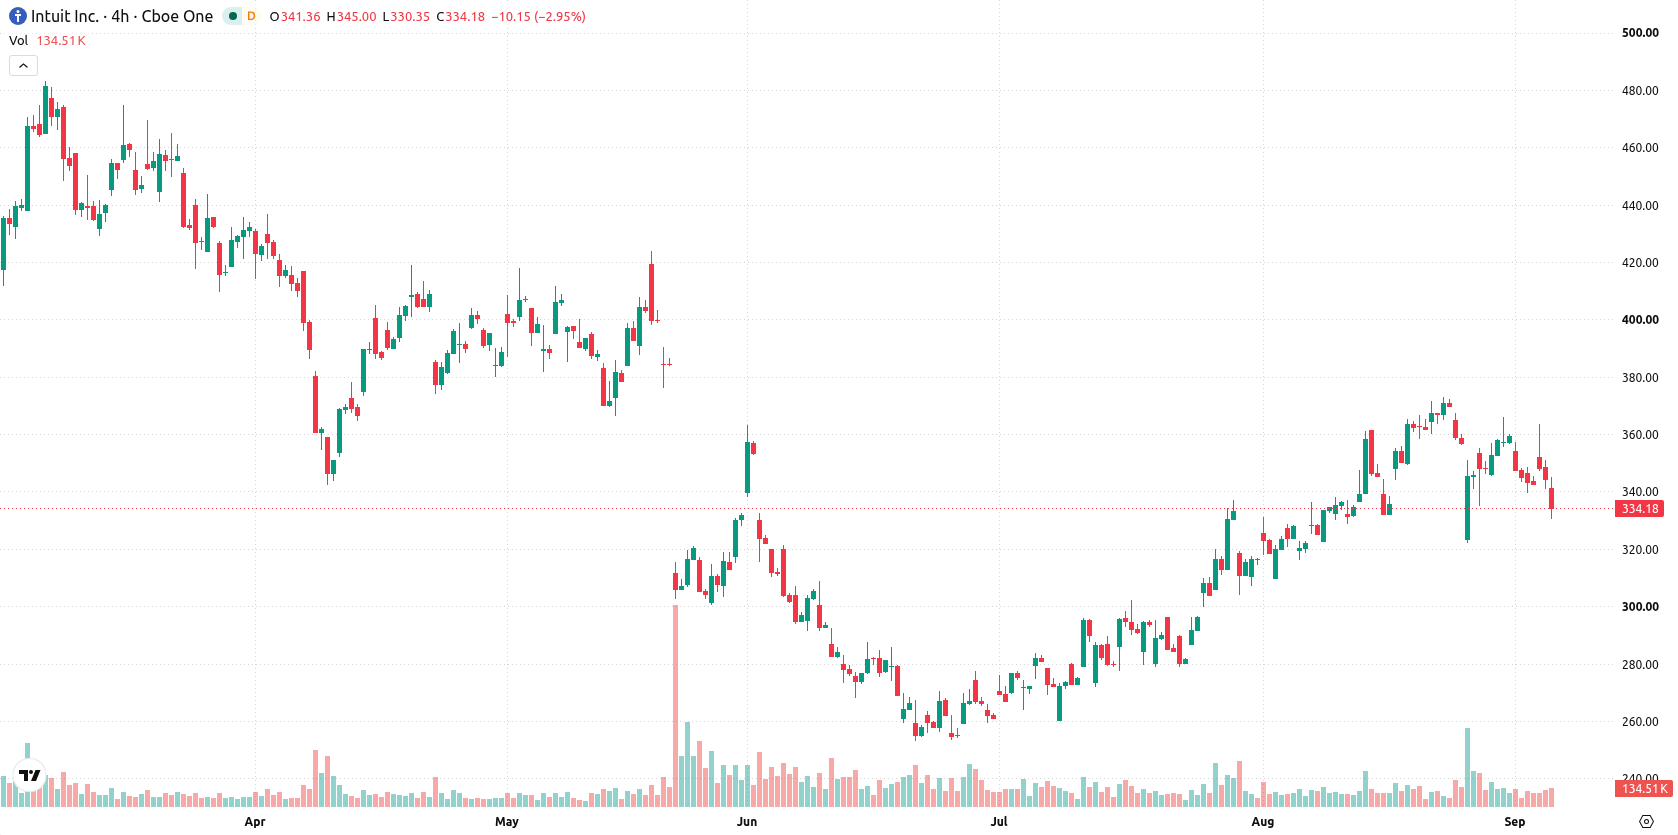
Limited medium-term support as sellers dominate and signals diverge
Intuit is currently trading below the 20-day moving average at $349.09 and well below the 200-day moving average at $428.8, but remains above the 50-day moving average at $314.1. This configuration suggests short-term and long-term pressure from sellers, with only the medium-term trend providing limited support. Near-term resistance is seen at $338 (Ichimoku Kijun), while support stands at the session’s low of $331.71. Momentum signals are mixed: the MACD points to strong buy momentum, the ADX is neutral with no clear trend, the RSI is at 52.44 with a buy signal, Stochastic RSI at 4.2 indicates oversold conditions, and the CCI reads neutral. Bull/Bear Power at 6.21 signals intraday buyer dominance, but it is already overbought, and the Awesome Oscillator is neutral. Despite intraday volatility at 2.98% and a downside gap at the open, the tone suggests heavy selling and uncertainty in the short-term trend.
Earlier, analysts noted that Intuit shares were under persistent downside pressure despite positive corporate actions and technical uncertainty. The latest results and market response reinforce this cautious outlook, with key levels at $338 and $331.71 providing the immediate thresholds to monitor for a breakout or additional weakness in the coming sessions.











-
 Afghanistan
-
 Albania
-
 Algeria
-
 Angola
-
 Argentina
-
 Armenia
-
 Australia
-
 Austria
-
 Azerbaijan
-
 Bahamas
-
 Bahrain
-
 Bangladesh
-
 Belarus
-
 Belgium
-
 Bolivia
-
 Botswana
-
 Brazil
-
 Brunei
-
 Bulgaria
-
 Cambodia
-
 Cameroon
-
 Canada
-
 Chile
-
 China
-
 Colombia
-
 Congo
-
 Costa Rica
-
 Cote d'Ivoire
-
 Croatia
-
 Cuba
-
 Cyprus
-
 Czechia
-
 DR Congo
-
 Denmark
-
 Dominican Republic
-
 Ecuador
-
 Egypt
-
 El Salvador
-
 Estonia
-
 Eswatini
-
 Ethiopia
-
 Finland
-
 France
-
 Georgia
-
 Germany
-
 Ghana
-
 Greece
-
 Haiti
-
 Hong Kong
-
 Hungary
-
 India
-
 Indonesia
-
 Iran, Islamic republic
-
 Iraq
-
 Ireland
-
 Israel
-
 Italy
-
 Jamaica
-
 Japan
-
 Jordan
-
 Kazakhstan
-
 Kenya
-
 Korea
-
 Kuwait
-
 Kyrgyzstan
-
 Laos
-
 Latvia
-
 Lebanon
-
 Lesotho
-
 Libya
-
 Lithuania
-
 Luxembourg
-
 Madagascar
-
 Malaysia
-
 Malta
-
 Mauritius
-
 Mexico
-
 Moldova
-
 Mongolia
-
 Montenegro
-
 Morocco
-
 Mozambique
-
 Myanmar
-
 Namibia
-
 Nepal
-
 Netherlands
-
 New Zealand
-
 Nigeria
-
 North Macedonia
-
 Norway
-
 Oman
-
 Pakistan
-
 Palestine
-
 Panama
-
 Papua New Guinea
-
 Paraguay
-
 Peru
-
 Philippines
-
 Poland
-
 Portugal
-
 Puerto Rico
-
 Qatar
-
 Reunion
-
 Romania
-
 Rwanda
-
 Saudi Arabia
-
 Serbia
-
 Singapore
-
 Slovakia
-
 Slovenia
-
 Somalia
-
 South Africa
-
 Spain
-
 Sri Lanka
-
 Sweden
-
 Switzerland
-
 Syria
-
 Taiwan
-
 Tajikistan
-
 Tanzania
-
 Thailand
-
 Trinidad and Tobago
-
 Tunisia
-
 Turkey
-
 UAE
-
 Uganda
-
 Ukraine
-
 United Kingdom
-
United States
-
 Uruguay
-
 Uzbekistan
-
 Venezuela
-
 Vietnam
-
 Yemen
-
 Zambia
-
 Zimbabwe
- Forex
- Crypto












