

Nano Dimension shares technical analysis: Challenge at $1.66 resistance

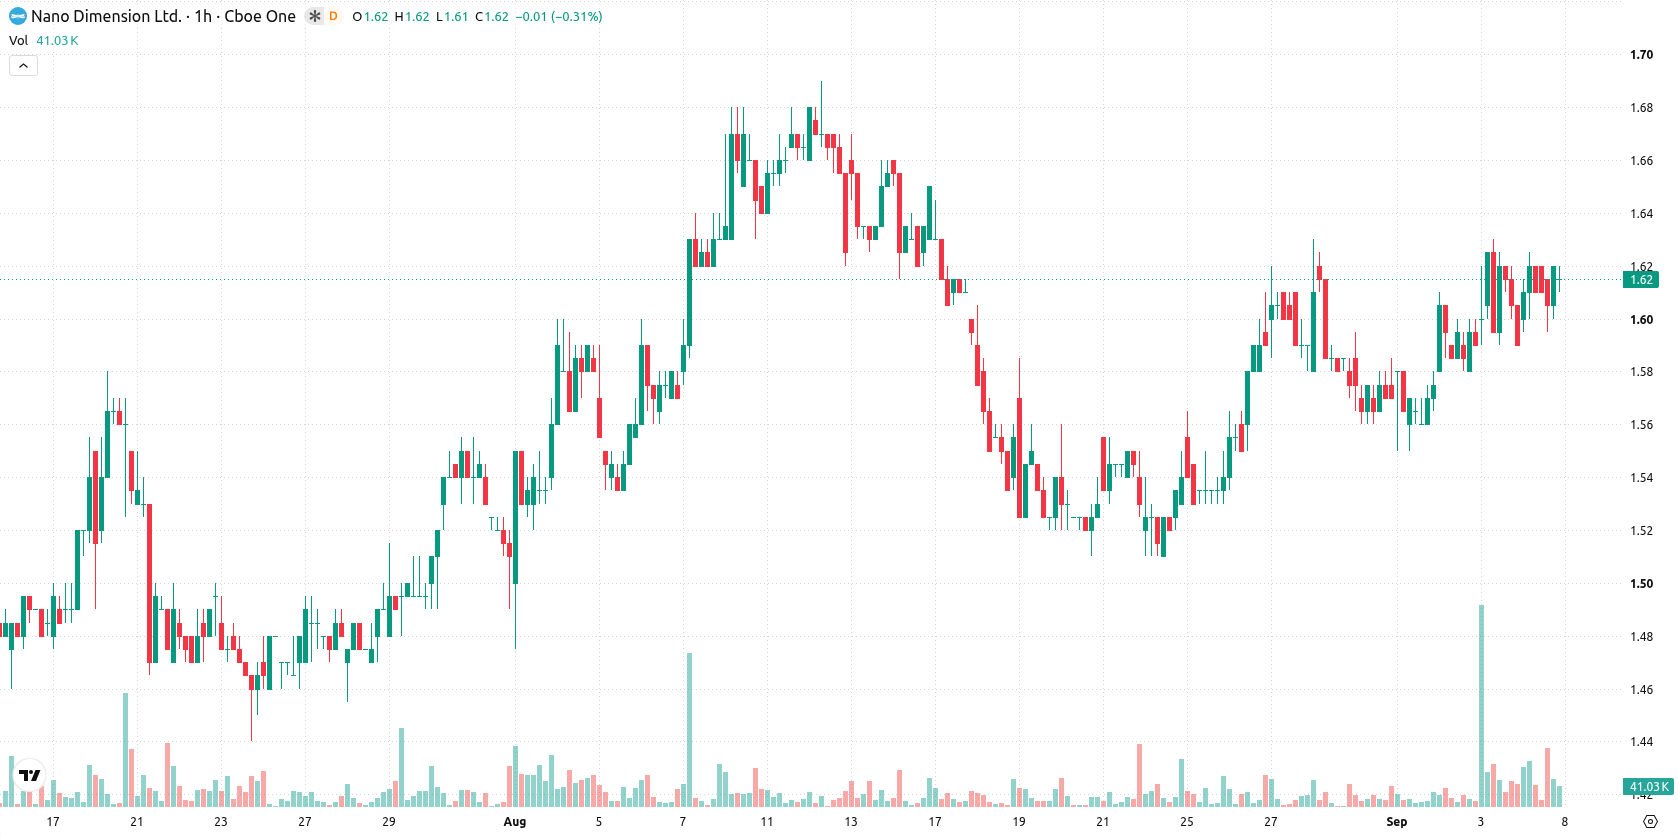
Nano Dimension (NNDM) stock is trading at $1.62, up 1.25% on the day and closing near its session high. The price has moved further above its short-term averages while remaining constrained below longer-term benchmarks.
 1.28
1.38
Highlights
- The price is trading with a short to medium term bullish bias but faces long term downward pressure.
- Intraday technical indicators give mixed but mostly bullish signals, with strong buyer activity and no extreme momentum readings.
- For the next 2 to 3 trading days, price is expected to consolidate in a $1.58 to $1.66 range with an upward move highly probable.
Short-term bullish signals strengthen as longer-term resistance holds
On the technical front, NNDM has managed to surpass both the MA-20 and MA-50 on the hourly chart, indicating short-term bullish activity. However, it remains below the MA-200 on the daily timeframe, signaling ongoing long-term resistance. The Ichimoku Kijun level at $1.59 currently acts as immediate support. Momentum indicators present a mixed but mildly bullish configuration intraday: MACD is flashing a Buy signal, ADX is Neutral, RSI sits at 56.79, and CCI is in Buy territory, while Stochastic RSI remains Neutral. Bull/Bear Power highlights strong buyer dominance in intraday trading, though the Neutral ADX and Stochastic RSI suggest some uncertainty regarding trend strength.
High breakout risk as consolidation persists near volatility boundaries
Looking ahead to the next 2–3 trading days, NNDM is expected to consolidate within a typical volatility band between $1.58 and $1.66. The probability of an upward breakout from this range is assessed as very high, while a downside break is considered very unlikely. The baseline scenario anticipates continued consolidation within these boundaries. A move above resistance would confirm a bullish scenario, whereas a decisive drop below the $1.59 support would signal a shift to the downside.
Earlier, analysts noted that Nano Dimension's price action was marked by a broadly sideways trend amid mixed technical indicators. The latest data reinforces this view, with short-term bullish signals persisting but traders advised to monitor for a confirmed breakout or breakdown from the current consolidation range to determine the next move.






Latest Nano Dimension News




-
 Afghanistan
-
 Albania
-
 Algeria
-
 Angola
-
 Argentina
-
 Armenia
-
 Australia
-
 Austria
-
 Azerbaijan
-
 Bahamas
-
 Bahrain
-
 Bangladesh
-
 Belarus
-
 Belgium
-
 Bolivia
-
 Botswana
-
 Brazil
-
 Brunei
-
 Bulgaria
-
 Cambodia
-
 Cameroon
-
 Canada
-
 Chile
-
 China
-
 Colombia
-
 Congo
-
 Costa Rica
-
 Cote d'Ivoire
-
 Croatia
-
 Cuba
-
 Cyprus
-
 Czechia
-
 DR Congo
-
 Denmark
-
 Dominican Republic
-
 Ecuador
-
 Egypt
-
 El Salvador
-
 Estonia
-
 Eswatini
-
 Ethiopia
-
 Finland
-
 France
-
 Georgia
-
 Germany
-
 Ghana
-
 Greece
-
 Haiti
-
 Hong Kong
-
 Hungary
-
 India
-
 Indonesia
-
 Iran, Islamic republic
-
 Iraq
-
 Ireland
-
 Israel
-
 Italy
-
 Jamaica
-
 Japan
-
 Jordan
-
 Kazakhstan
-
 Kenya
-
 Korea
-
 Kuwait
-
 Kyrgyzstan
-
 Laos
-
 Latvia
-
 Lebanon
-
 Lesotho
-
 Libya
-
 Lithuania
-
 Luxembourg
-
 Madagascar
-
 Malaysia
-
 Malta
-
 Mauritius
-
 Mexico
-
 Moldova
-
 Mongolia
-
 Montenegro
-
 Morocco
-
 Mozambique
-
 Myanmar
-
 Namibia
-
 Nepal
-
 Netherlands
-
 New Zealand
-
 Nigeria
-
 North Macedonia
-
 Norway
-
 Oman
-
 Pakistan
-
 Palestine
-
 Panama
-
 Papua New Guinea
-
 Paraguay
-
 Peru
-
 Philippines
-
 Poland
-
 Portugal
-
 Puerto Rico
-
 Qatar
-
 Reunion
-
 Romania
-
 Rwanda
-
 Saudi Arabia
-
 Serbia
-
 Singapore
-
 Slovakia
-
 Slovenia
-
 Somalia
-
 South Africa
-
 Spain
-
 Sri Lanka
-
 Sweden
-
 Switzerland
-
 Syria
-
 Taiwan
-
 Tajikistan
-
 Tanzania
-
 Thailand
-
 Trinidad and Tobago
-
 Tunisia
-
 Turkey
-
 UAE
-
 Uganda
-
 Ukraine
-
 United Kingdom
-
United States
-
 Uruguay
-
 Uzbekistan
-
 Venezuela
-
 Vietnam
-
 Yemen
-
 Zambia
-
 Zimbabwe
- Forex
- Crypto












