


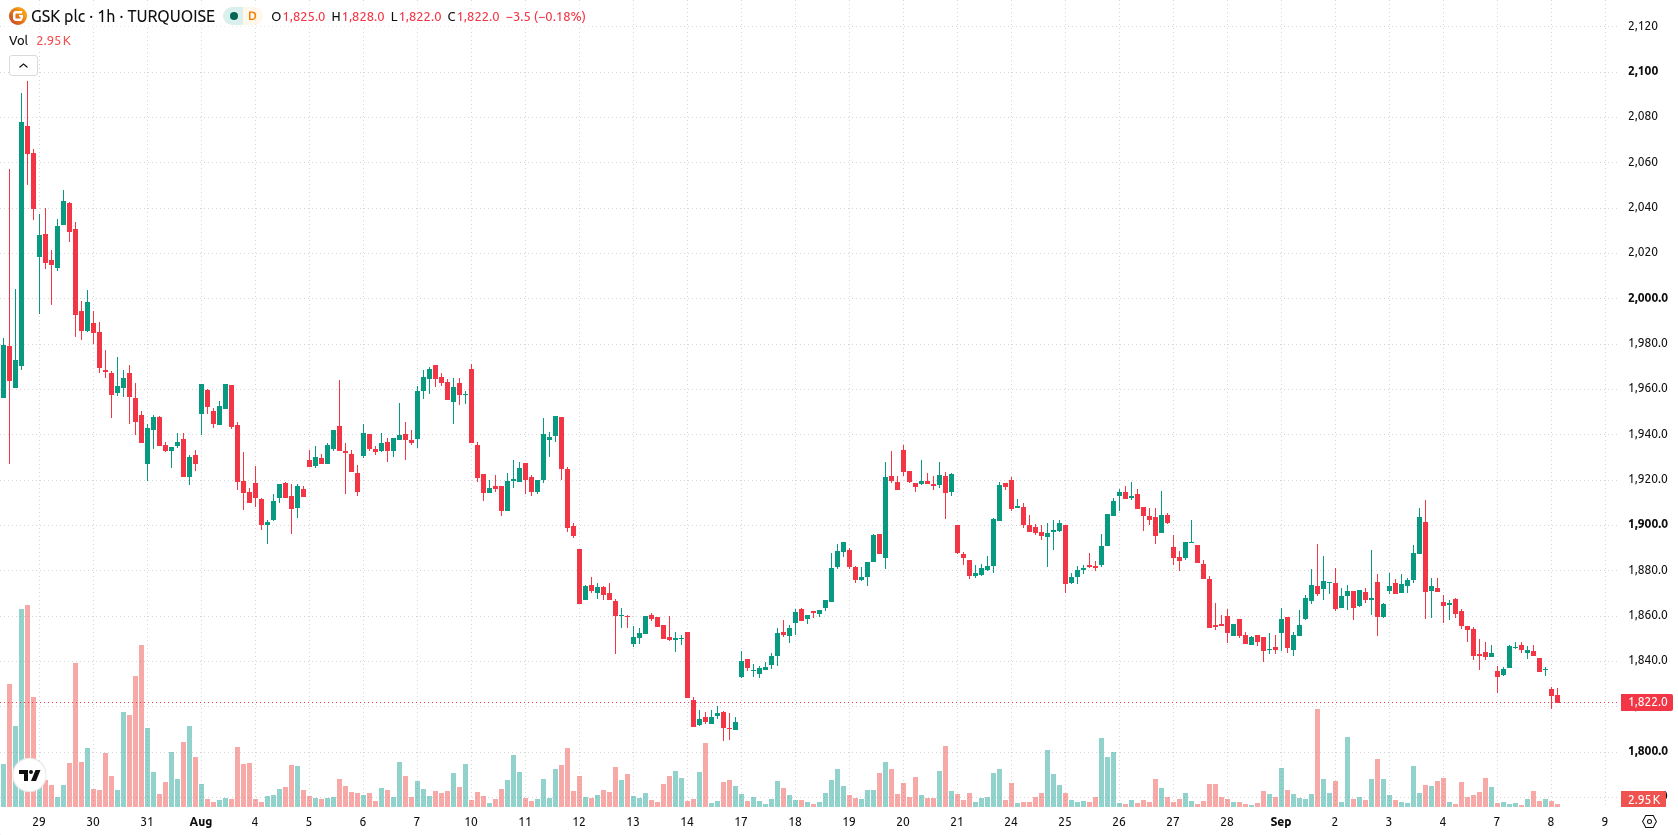
GSK (GSK) stock is trading at GBX1,818.50, posting a modest decline on the day and sitting below its main moving averages.
 1771.00
1790.50
1771.00
1790.50
Highlights
- Shares of GSK/GBX are trading below key moving averages across all timeframes, confirming sustained selling pressure.
- Momentum indicators signal a bearish trend, with multiple sell signals and readings in oversold territory.
- Expected price range is GBX1,780 to GBX1,856, with a high probability of further declines and low chance of an upward reversal short term.
Seller momentum persists as indicators flag oversold zone
GSK is trading below its MA-20 at GBX1,846, MA-50 at GBX1,858, and the long-term MA-200 at GBX1,949. The Ichimoku Kijun sits at GBX1,865, acting as immediate resistance. Momentum indicators remain weak: MACD signals a sell, ADX is neutral, and RSI reads 29.63, indicating oversold conditions. Stochastic RSI and CCI are also oversold, while Bull/Bear Power and the Awesome Oscillator both confirm seller dominance in intraday action.
Sideways drift likely as bearish risks outweigh rebound
The expected price range for the coming sessions is GBX1,780 to GBX1,856. With the probability of a further decline assessed as very high, the baseline scenario is for GSK to move sideways within this band. The likelihood of an upward reversal is low in the short term. A move above resistance would be required for a bullish breakout, while a drop below support would reinforce the bearish trend.
Earlier, analysts noted a return to profitability for James Fisher and IQE, driven by strong performances in select sectors despite ongoing market uncertainties. The current technical outlook for GSK introduces a fresh perspective, with traders advised to watch for a decisive move above GBX1,865 resistance or a break below GBX1,780 support as indicators of the next directional move.










-
 Afghanistan
-
 Albania
-
 Algeria
-
 Angola
-
 Argentina
-
 Armenia
-
 Australia
-
 Austria
-
 Azerbaijan
-
 Bahamas
-
 Bahrain
-
 Bangladesh
-
 Belarus
-
 Belgium
-
 Bolivia
-
 Botswana
-
 Brazil
-
 Brunei
-
 Bulgaria
-
 Cambodia
-
 Cameroon
-
 Canada
-
 Chile
Chile
-
 China
China
-
 Colombia
-
 Congo
Congo
-
 Costa Rica
-
 Cote d'Ivoire
-
 Croatia
-
 Cuba
Cuba
-
 Cyprus
-
 Czechia
-
 DR Congo
-
 Denmark
-
 Dominican Republic
-
 Ecuador
-
 Egypt
Egypt
-
 El Salvador
-
 Estonia
-
 Eswatini
-
 Ethiopia
-
 Finland
-
 France
-
 Georgia
-
 Germany
-
 Ghana
Ghana
-
 Greece
-
 Haiti
Haiti
-
 Hong Kong
-
 Hungary
-
 India
India
-
 Indonesia
-
 Iran, Islamic republic
-
 Iraq
Iraq
-
 Ireland
-
 Israel
-
 Italy
Italy
-
 Jamaica
-
 Japan
Japan
-
 Jordan
-
 Kazakhstan
-
 Kenya
Kenya
-
 Korea
Korea
-
 Kuwait
-
 Kyrgyzstan
-
 Laos
Laos
-
 Latvia
-
 Lebanon
-
 Lesotho
-
 Libya
Libya
-
 Lithuania
-
 Luxembourg
-
 Madagascar
-
 Malaysia
-
 Malta
Malta
-
 Mauritius
-
 Mexico
-
 Moldova
-
 Mongolia
-
 Montenegro
-
 Morocco
-
 Mozambique
-
 Myanmar
-
 Namibia
-
 Nepal
Nepal
-
 Netherlands
-
 New Zealand
-
 Nigeria
-
 North Macedonia
-
 Norway
-
 Oman
Oman
-
 Pakistan
-
 Palestine
-
 Panama
-
 Papua New Guinea
-
 Paraguay
-
 Peru
Peru
-
 Philippines
-
 Poland
-
 Portugal
-
 Puerto Rico
-
 Qatar
Qatar
-
 Reunion
-
 Romania
-
 Rwanda
-
 Saudi Arabia
-
 Serbia
-
 Singapore
-
 Slovakia
-
 Slovenia
-
 Somalia
-
 South Africa
-
 Spain
Spain
-
 Sri Lanka
-
 Sweden
-
 Switzerland
-
 Syria
Syria
-
 Taiwan
-
 Tajikistan
-
 Tanzania
-
 Thailand
-
 Trinidad and Tobago
-
 Tunisia
-
 Turkey
-
 UAE
UAE
-
 Uganda
-
 Ukraine
-
 United Kingdom
-
United States
-
 Uruguay
-
 Uzbekistan
-
 Venezuela
-
 Vietnam
-
 Yemen
Yemen
-
 Zambia
-
 Zimbabwe
- Forex
- Crypto












