

Persimmon shares technical analysis: GBX1,104 support under pressure after recent seller dominance

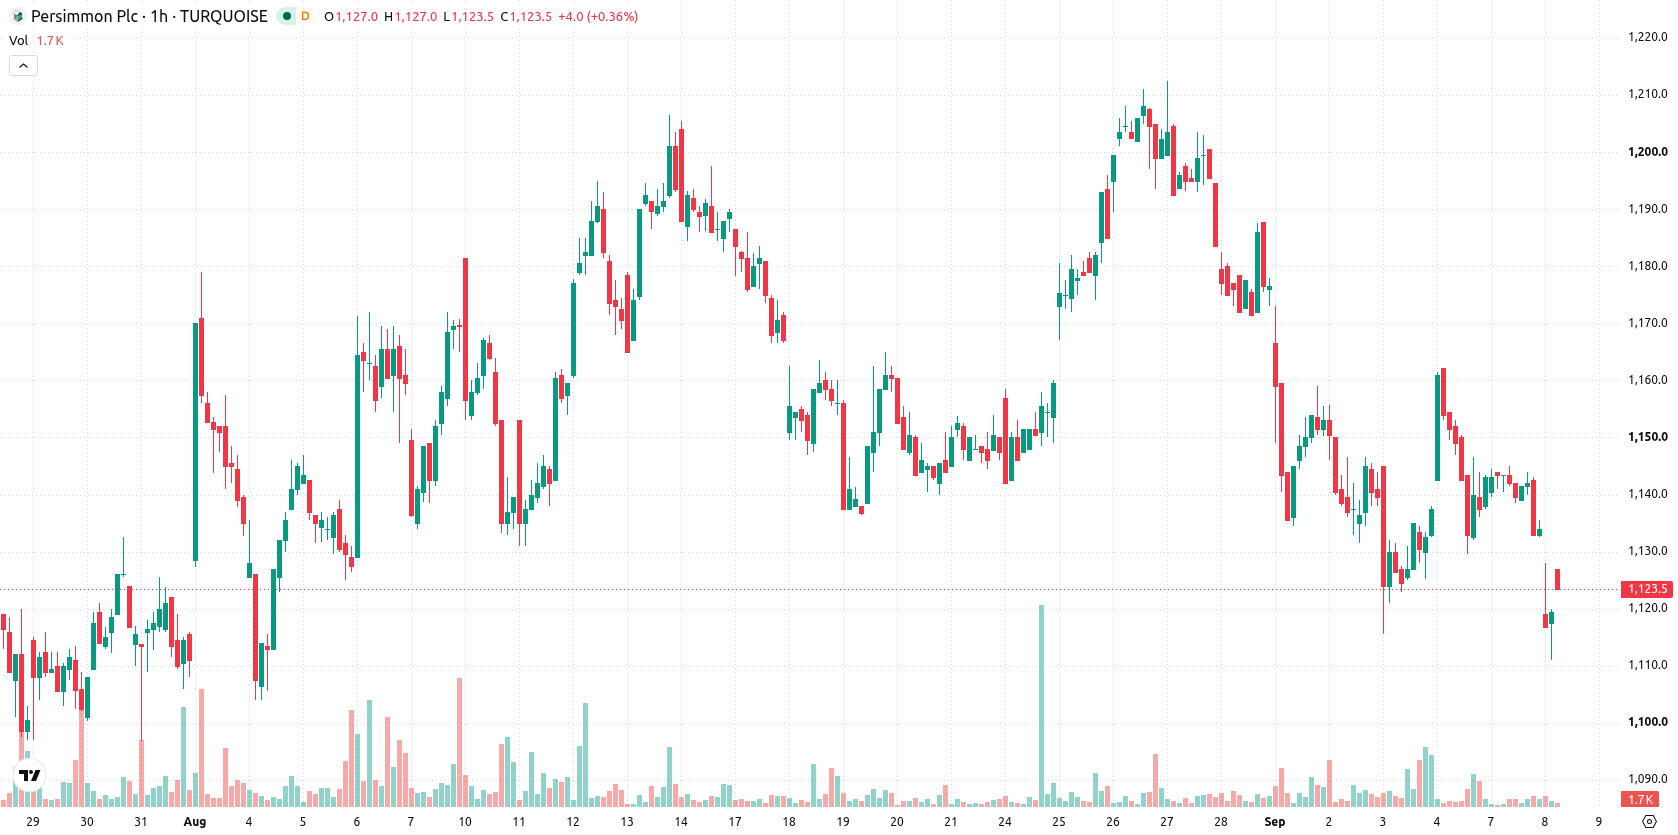
Persimmon (PSN) stock is trading at GBX1,125.50, showing a modest slip from its previous session close. The price remains below its key moving averages, reflecting ongoing downward momentum.
 1260.50
1249.00
1260.50
1249.00
Highlights
- PSN stock trades below all key moving averages with the price at GBX1,125, reflecting sustained seller pressure.
- Momentum indicators show persistent weakness and oversold conditions, with broad agreement among sell signals and no confirmed bullish reversal.
- Over the next 2 to 3 days, the expected price range is GBX1,104 to GBX1,146, with a 78% probability of further downside.
Seller control extends as oversold readings diverge from rebound
PSN trades below its MA-20 and MA-50 levels at GBX1,140 and GBX1,142 on the hourly chart, and well below the MA-200 at GBX1,213 on the daily chart. Immediate resistance is set at the Ichimoku Kijun level of GBX1,138. Momentum indicators reinforce weak conditions: RSI is at 31.54 (Sell), MACD and Awesome Oscillator are also on Sell, ADX is Neutral, and Stoch RSI, CCI, and Bull/Bear Power all indicate oversold levels. Bull/Bear Power specifically confirms seller dominance over intraday frames. While today’s rebound tested the high of the range amid moderate volatility, price action has not been confirmed by an upturn in indicator readings, creating a divergence between the short-term push and sustained negative momentum.
Sideways trading expected as resistance and support cap moves
In the near term, PSN is expected to fluctuate within the GBX1,104 to GBX1,146 volatility band relative to current levels. The probability of an upward move is 22%, while the likelihood of further downside is 78%. The baseline scenario anticipates sideways trading within this range over the next 2–3 sessions. A break above resistance at the Kijun (GBX1,138) could open the way toward the upper boundary, while a breach of support at GBX1,104 might prompt an extension of losses.
Earlier, analysts noted that Persimmon shares were in a period of consolidation marked by a lack of clear directional commitment. The latest technical developments reinforce this indecision, suggesting traders closely monitor the GBX1,138 resistance and GBX1,104 support as pivotal levels for any potential breakout or extended downside.





Latest Persimmon News






-
 Afghanistan
-
 Albania
-
 Algeria
-
 Angola
-
 Argentina
-
 Armenia
-
 Australia
-
 Austria
-
 Azerbaijan
-
 Bahamas
-
 Bahrain
-
 Bangladesh
-
 Belarus
-
 Belgium
-
 Bolivia
-
 Botswana
-
 Brazil
-
 Brunei
-
 Bulgaria
-
 Cambodia
-
 Cameroon
-
 Canada
-
 Chile
Chile
-
 China
China
-
 Colombia
-
 Congo
Congo
-
 Costa Rica
-
 Cote d'Ivoire
-
 Croatia
-
 Cuba
Cuba
-
 Cyprus
-
 Czechia
-
 DR Congo
-
 Denmark
-
 Dominican Republic
-
 Ecuador
-
 Egypt
Egypt
-
 El Salvador
-
 Estonia
-
 Eswatini
-
 Ethiopia
-
 Finland
-
 France
-
 Georgia
-
 Germany
-
 Ghana
Ghana
-
 Greece
-
 Haiti
Haiti
-
 Hong Kong
-
 Hungary
-
 India
India
-
 Indonesia
-
 Iran, Islamic republic
-
 Iraq
Iraq
-
 Ireland
-
 Israel
-
 Italy
Italy
-
 Jamaica
-
 Japan
Japan
-
 Jordan
-
 Kazakhstan
-
 Kenya
Kenya
-
 Korea
Korea
-
 Kuwait
-
 Kyrgyzstan
-
 Laos
Laos
-
 Latvia
-
 Lebanon
-
 Lesotho
-
 Libya
Libya
-
 Lithuania
-
 Luxembourg
-
 Madagascar
-
 Malaysia
-
 Malta
Malta
-
 Mauritius
-
 Mexico
-
 Moldova
-
 Mongolia
-
 Montenegro
-
 Morocco
-
 Mozambique
-
 Myanmar
-
 Namibia
-
 Nepal
Nepal
-
 Netherlands
-
 New Zealand
-
 Nigeria
-
 North Macedonia
-
 Norway
-
 Oman
Oman
-
 Pakistan
-
 Palestine
-
 Panama
-
 Papua New Guinea
-
 Paraguay
-
 Peru
Peru
-
 Philippines
-
 Poland
-
 Portugal
-
 Puerto Rico
-
 Qatar
Qatar
-
 Reunion
-
 Romania
-
 Rwanda
-
 Saudi Arabia
-
 Serbia
-
 Singapore
-
 Slovakia
-
 Slovenia
-
 Somalia
-
 South Africa
-
 Spain
Spain
-
 Sri Lanka
-
 Sweden
-
 Switzerland
-
 Syria
Syria
-
 Taiwan
-
 Tajikistan
-
 Tanzania
-
 Thailand
-
 Trinidad and Tobago
-
 Tunisia
-
 Turkey
-
 UAE
UAE
-
 Uganda
-
 Ukraine
-
 United Kingdom
-
United States
-
 Uruguay
-
 Uzbekistan
-
 Venezuela
-
 Vietnam
-
 Yemen
Yemen
-
 Zambia
-
 Zimbabwe
- Forex
- Crypto












