

IBM shares technical backdrop favors further consolidation as volatility picks up: weekly analysis

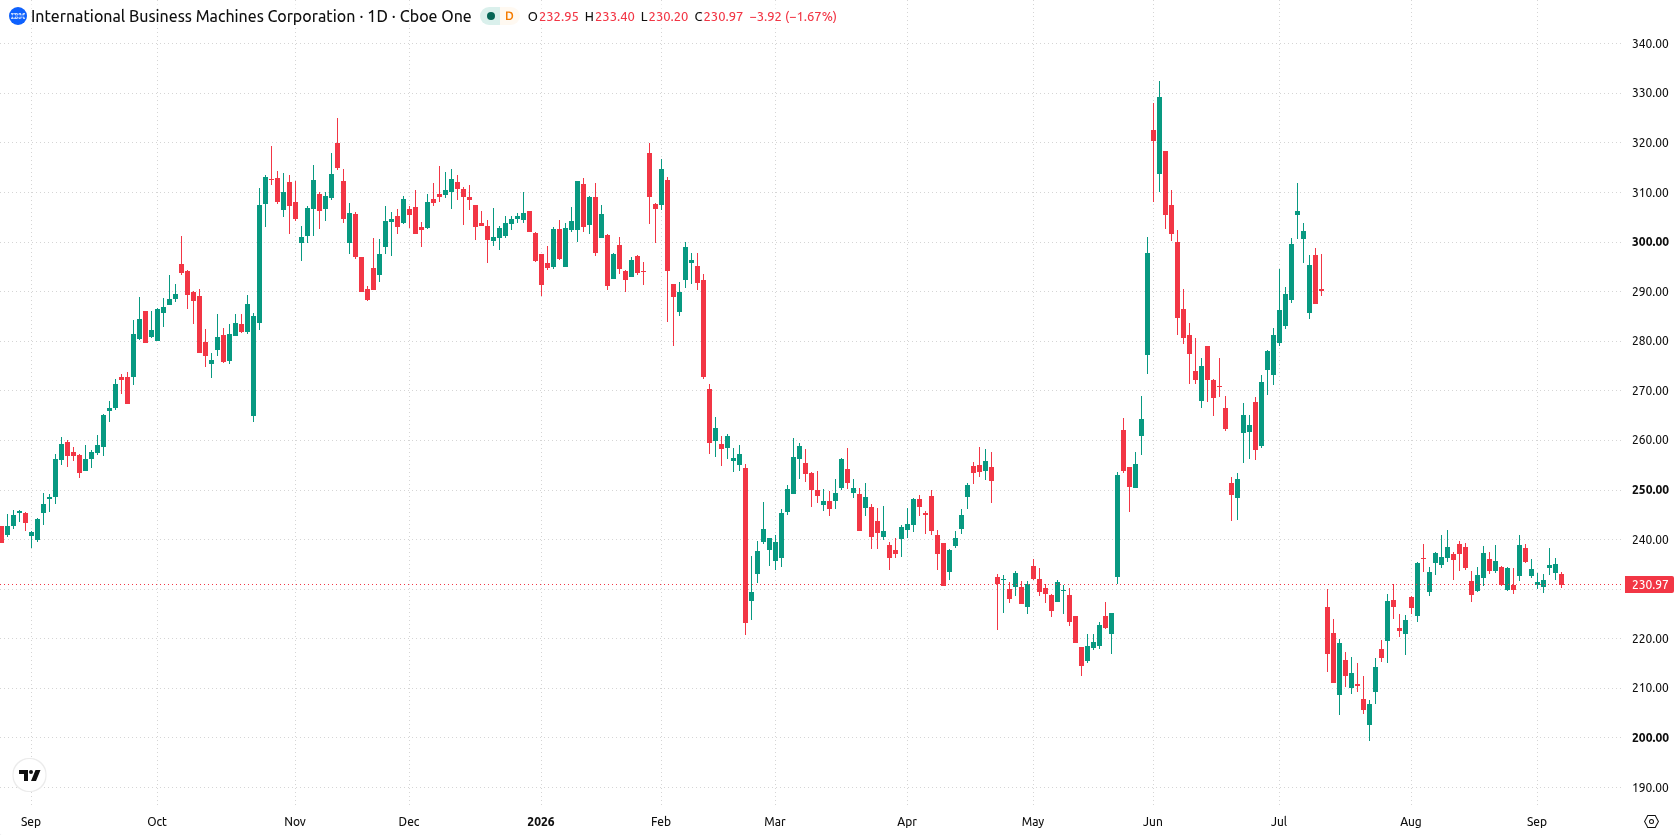
Shares of International Business Machines Corporation (IBM) are trading near $231 after a drop of about 1.6% this week, as technical signals remain decisively negative despite a few conflicting indicators. Downside momentum is evident, with rebound odds staying low and the price anchored at the lower end of its recent range — setting up another cautious week ahead.
 250.50
259.84
Highlights
- Shares of IBM declined 1.61% to $231.24 over the past week and trade below key moving averages.
- Technical momentum and trend indicators are bearish, with negative MACD and volatility at 3.88%.
- IBM stock is expected to stay rangebound between $229.25 support and $234.31 resistance, with a base case for consolidation.
Corporate launches and fraud probe intensify volatility risk and sentiment focus
According to ad-hoc-news.de, IBM has rolled out the IBM Concert AI Risk platform while facing a securities fraud investigation, both factors increasing uncertainty for the stock. The upcoming dividend payment also draws attention, as investors weigh potential payouts against legal and operational risks. These developments have heightened focus on IBM's ability to manage volatility and sentiment in the technology and AI sector over the coming week.
Bearish signals persist as technical indicators and narrowed range drive consolidation
On the daily chart, IBM is exhibiting a contained move within a narrow range, as volatility over the past week reached 3.88%. MACD remains firmly negative with a reading of -0.84, and most momentum metrics lean bearish, though HMA offers a slight counterpoint with a mild buy signal at $233.04. The nearest support sits at $229.25, drawn from the Ichimoku Kijun, while resistance aligns with the 20-day moving average at $234.31. With the price sitting in the lower part of the weekly range, the technical backdrop favors further consolidation rather than a sharp rebound.
Rangebound trend likely as breakout scenarios hinge on support and resistance shifts
Over the next five trading days, IBM is expected to fluctuate between $227.25 and $241.71. There is a 42% probability of an increase and a 58% probability of a decrease. The base case suggests the stock will remain rangebound between support at $229.25 and resistance at $234.31. A close above resistance would open up room for a move toward $241.71, while a sustained drop below support could see the stock retesting the $227.25 level.
Previously it was reported that IBM was in a cautious consolidation phase, with downside risks dominating the near-term outlook. The current analysis adds legal and product deployment challenges to the equation, underscoring the importance of monitoring the $229.25 support level as a pivotal indicator for potential volatility in the days ahead.










-
 Afghanistan
-
 Albania
-
 Algeria
-
 Angola
-
 Argentina
-
 Armenia
-
 Australia
-
 Austria
-
 Azerbaijan
-
 Bahamas
-
 Bahrain
-
 Bangladesh
-
 Belarus
-
 Belgium
-
 Bolivia
-
 Botswana
-
 Brazil
-
 Brunei
-
 Bulgaria
-
 Cambodia
-
 Cameroon
-
 Canada
-
 Chile
-
 China
-
 Colombia
-
 Congo
-
 Costa Rica
-
 Cote d'Ivoire
-
 Croatia
-
 Cuba
-
 Cyprus
-
 Czechia
-
 DR Congo
-
 Denmark
-
 Dominican Republic
-
 Ecuador
-
 Egypt
-
 El Salvador
-
 Estonia
-
 Eswatini
-
 Ethiopia
-
 Finland
-
 France
-
 Georgia
-
 Germany
-
 Ghana
-
 Greece
-
 Haiti
-
 Hong Kong
-
 Hungary
-
 India
-
 Indonesia
-
 Iran, Islamic republic
-
 Iraq
-
 Ireland
-
 Israel
-
 Italy
-
 Jamaica
-
 Japan
-
 Jordan
-
 Kazakhstan
-
 Kenya
-
 Korea
-
 Kuwait
-
 Kyrgyzstan
-
 Laos
-
 Latvia
-
 Lebanon
-
 Lesotho
-
 Libya
-
 Lithuania
-
 Luxembourg
-
 Madagascar
-
 Malaysia
-
 Malta
-
 Mauritius
-
 Mexico
-
 Moldova
-
 Mongolia
-
 Montenegro
-
 Morocco
-
 Mozambique
-
 Myanmar
-
 Namibia
-
 Nepal
-
 Netherlands
-
 New Zealand
-
 Nigeria
-
 North Macedonia
-
 Norway
-
 Oman
-
 Pakistan
-
 Palestine
-
 Panama
-
 Papua New Guinea
-
 Paraguay
-
 Peru
-
 Philippines
-
 Poland
-
 Portugal
-
 Puerto Rico
-
 Qatar
-
 Reunion
-
 Romania
-
 Rwanda
-
 Saudi Arabia
-
 Serbia
-
 Singapore
-
 Slovakia
-
 Slovenia
-
 Somalia
-
 South Africa
-
 Spain
-
 Sri Lanka
-
 Sweden
-
 Switzerland
-
 Syria
-
 Taiwan
-
 Tajikistan
-
 Tanzania
-
 Thailand
-
 Trinidad and Tobago
-
 Tunisia
-
 Turkey
-
 UAE
-
 Uganda
-
 Ukraine
-
 United Kingdom
-
United States
-
 Uruguay
-
 Uzbekistan
-
 Venezuela
-
 Vietnam
-
 Yemen
-
 Zambia
-
 Zimbabwe
- Forex
- Crypto












