

Amazon shares remain in narrow range as uncertainty clouds trend outlook: weekly analysis

Shares of Amazon.com, Inc. (AMZN) are trading near $253 after a decline of about 2% over the past week, with the latest drop stretching momentum into oversold territory. The daily chart highlights mixed signals — price remains below key resistance, but a narrow range and short-term weakness point to uncertainty ahead.
 254.62
Highlights
- Shares of Amazon fell 2.26% over the past week to $252.59, closing near the bottom of the weekly range.
- Short-term momentum signals are mixed to weak, with the stock trading below its 20-day and 50-day averages but above the 200-day average.
- In the coming week, Amazon stock is expected to consolidate between $239.28 and $254.43, with a 53% probability of declining within a $234.92 to $254.7 range.
AI infrastructure push and new partnerships boost cloud sentiment this week
Amazon announced plans to increase its capital expenditures to $220 billion in 2026, aiming to ramp up artificial intelligence infrastructure, according to The Motley Fool and Cryptobriefing. Amazon Web Services continues to propel profit growth, reporting $42.2 billion in second-quarter revenue — its fastest growth rate in 18 quarters as noted by 24/7 Wall St. New strategic partnerships worth $75 billion with AI firms like Anthropic and OpenAI, and the addition of Qualcomm for AWS's AI silicon projects, further intensify Amazon's focus on cloud and AI leadership for the week ahead.
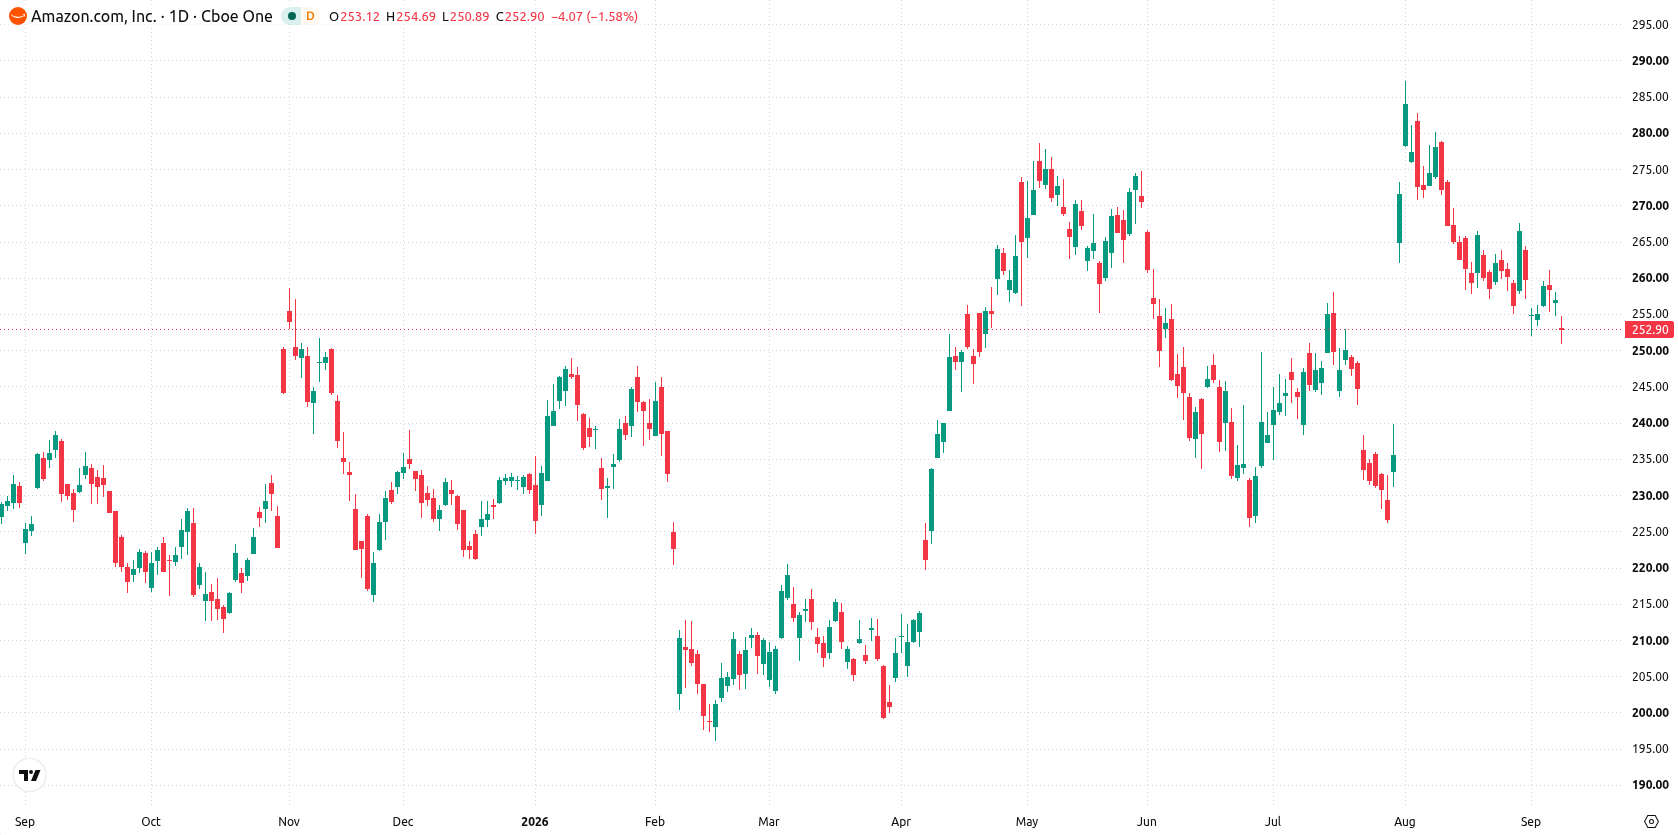
Neutral-to-weak bias persists as technicals test multi-month support
On the daily chart, structure is neutral-to-weak with price holding beneath the $254.43 resistance from the 50-day moving average and sitting closer to support at the 200-day. Short-term momentum is mixed: RSI stands at a neutral 48.21 while both CCI and Stochastic RSI are approaching oversold levels. Bull/Bear Power tilts oversold, but a contained move within a narrow range, paired with last week’s 1.85% volatility, signals a market lacking clear direction for now. Immediate levels to watch are the $239.28 support and the $254.43 resistance, with the Ichimoku Kijun at $270.54 reinforcing overhead pressure.
Consolidation favored barring breakout of key support or resistance this week
In the week ahead, the expected range stands at $234.92 to $254.7, with probabilities pointing 53% for a decrease and 47% for an increase. The base case favors continued consolidation between support at $239.28 and resistance at $254.43. A sustained move above $254.43 would open the way toward the Kijun and a bullish scenario. If the price fails at $239.28, bears could target the lower bound at $234.92.
Previously it was reported that Amazon's sterling bond sale capped a major global borrowing spree as the company raised funds to support its expanding AI infrastructure investments. The combination of increased capital expenditures, new AI partnerships, and current technical signals suggests traders should closely monitor the $239.28 support level for potential downside risk in the days ahead.






Latest Amazon News



-
 Afghanistan
-
 Albania
-
 Algeria
-
 Angola
-
 Argentina
-
 Armenia
-
 Australia
-
 Austria
-
 Azerbaijan
-
 Bahamas
-
 Bahrain
-
 Bangladesh
-
 Belarus
-
 Belgium
-
 Bolivia
-
 Botswana
-
 Brazil
-
 Brunei
-
 Bulgaria
-
 Cambodia
-
 Cameroon
-
 Canada
-
 Chile
-
 China
-
 Colombia
-
 Congo
-
 Costa Rica
-
 Cote d'Ivoire
-
 Croatia
-
 Cuba
-
 Cyprus
-
 Czechia
-
 DR Congo
-
 Denmark
-
 Dominican Republic
-
 Ecuador
-
 Egypt
-
 El Salvador
-
 Estonia
-
 Eswatini
-
 Ethiopia
-
 Finland
-
 France
-
 Georgia
-
 Germany
-
 Ghana
-
 Greece
-
 Haiti
-
 Hong Kong
-
 Hungary
-
 India
-
 Indonesia
-
 Iran, Islamic republic
-
 Iraq
-
 Ireland
-
 Israel
-
 Italy
-
 Jamaica
-
 Japan
-
 Jordan
-
 Kazakhstan
-
 Kenya
-
 Korea
-
 Kuwait
-
 Kyrgyzstan
-
 Laos
-
 Latvia
-
 Lebanon
-
 Lesotho
-
 Libya
-
 Lithuania
-
 Luxembourg
-
 Madagascar
-
 Malaysia
-
 Malta
-
 Mauritius
-
 Mexico
-
 Moldova
-
 Mongolia
-
 Montenegro
-
 Morocco
-
 Mozambique
-
 Myanmar
-
 Namibia
-
 Nepal
-
 Netherlands
-
 New Zealand
-
 Nigeria
-
 North Macedonia
-
 Norway
-
 Oman
-
 Pakistan
-
 Palestine
-
 Panama
-
 Papua New Guinea
-
 Paraguay
-
 Peru
-
 Philippines
-
 Poland
-
 Portugal
-
 Puerto Rico
-
 Qatar
-
 Reunion
-
 Romania
-
 Rwanda
-
 Saudi Arabia
-
 Serbia
-
 Singapore
-
 Slovakia
-
 Slovenia
-
 Somalia
-
 South Africa
-
 Spain
-
 Sri Lanka
-
 Sweden
-
 Switzerland
-
 Syria
-
 Taiwan
-
 Tajikistan
-
 Tanzania
-
 Thailand
-
 Trinidad and Tobago
-
 Tunisia
-
 Turkey
-
 UAE
-
 Uganda
-
 Ukraine
-
 United Kingdom
-
United States
-
 Uruguay
-
 Uzbekistan
-
 Venezuela
-
 Vietnam
-
 Yemen
-
 Zambia
-
 Zimbabwe
- Forex
- Crypto












