

Berkshire Hathaway shares weekly forecast: Rally runs into overbought conditions

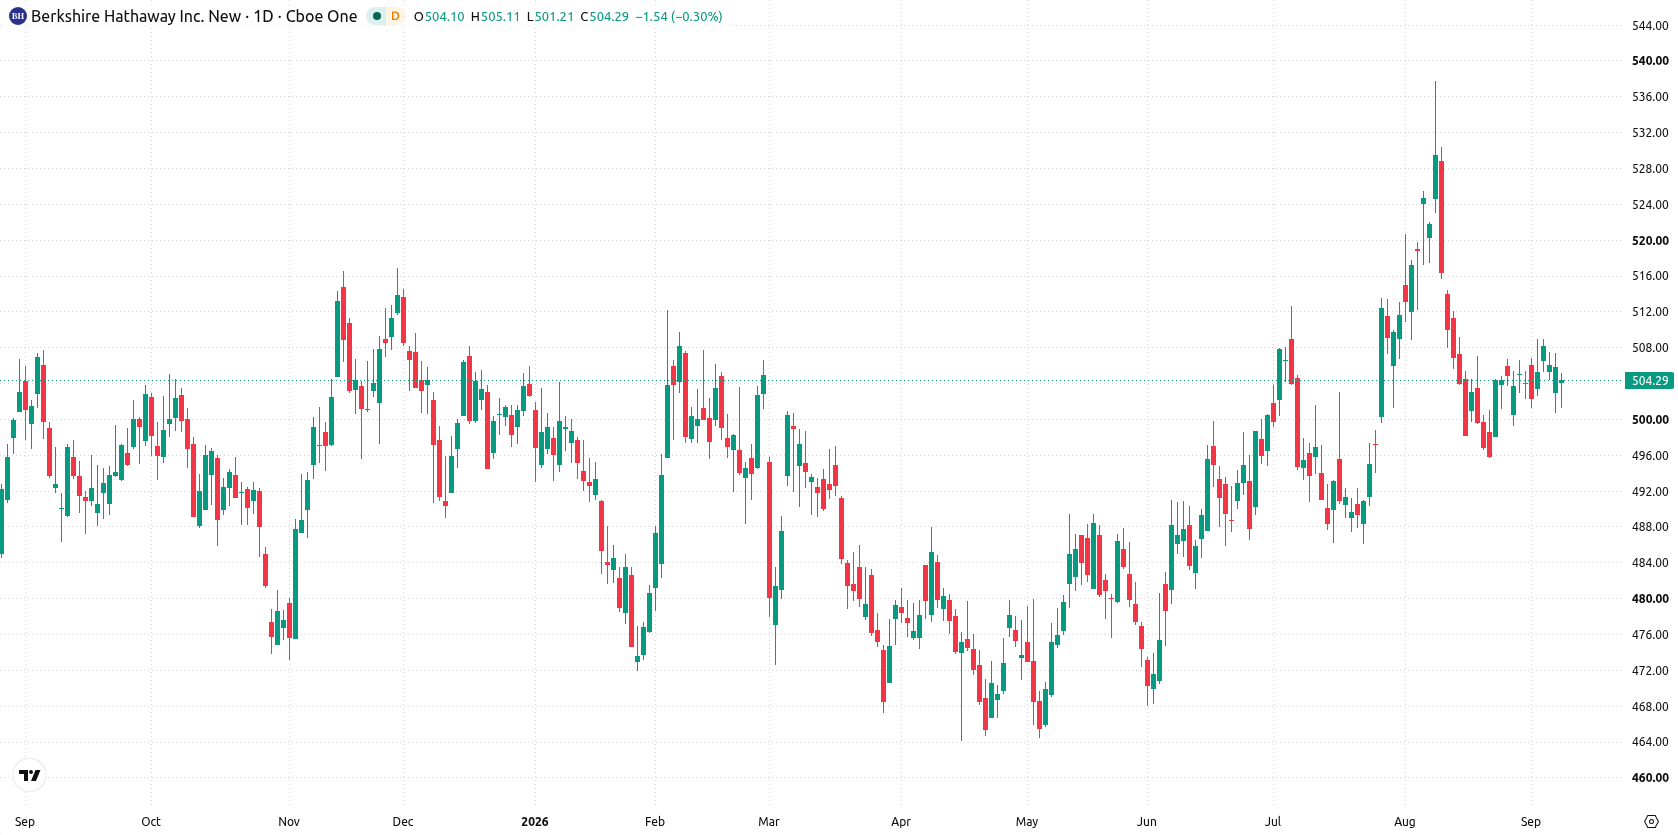
Shares of Berkshire Hathaway Inc. (BRK.B) are trading near $505 as the recent rally runs into overbought conditions. A tight trading range and mixed momentum signals set the stage for a cautious start to the coming week, with attention on whether support can continue to hold.
 547.05
548.64
Highlights
- Shares of Berkshire Hathaway remain nearly flat at $505.12, consolidating just above short-term moving averages.
- The stock has traded in a narrow range with volatility at 1.6% and mixed momentum, with some overbought signals present.
- Near-term range is expected between $483.49 to $508.7, with over 80% probability of a move higher and key resistance at $508.71.
Capital returns rise as Berkshire boosts repurchases and deepens AI exposure
Berkshire Hathaway CEO Greg Abel signaled on September 3, 2026, that the company intends to hold its investments in five major Japanese trading houses for decades and may further increase its stakes, as he told CNBC. According to Yahoo Finance, Berkshire spent $4.5 billion on share repurchases last quarter and an additional $3.3 billion in July 2026, reducing its share count and reflecting a continued commitment to capital returns. The company has also increased its position in Alphabet, making it BRK.B's third-largest holding and highlighted a growing focus on artificial intelligence and energy infrastructure.
Mixed momentum signals persist as weekly volatility narrows near resistance
The daily chart presents a flat structure, with price action showing a contained move within a narrow range and volatility over the past week at 1.6%. Momentum indicators are mixed: MACD points to a buy while Bull/Bear Power registers overbought conditions, and Stochastic RSI is approaching overbought territory at 75.26. Immediate support is at $504.19 (20-day MA), with resistance at $508.71 (recent high), while the Ichimoku Kijun at $516.72 acts as an additional resistance above.
Upside breakout risk grows as consolidation base holds into coming week
Over the next five trading days, the expected range is $483.49 to $508.7. There is a very high probability (more than 80%) of an increase and a very low probability (less than 20%) of a decrease. The base case is continued consolidation between $504.19 support and $508.71 resistance. A sustained move above $508.71 would open the door to testing the Ichimoku Kijun at $516.72, while a retreat below $504.19 may see the stock drift toward the $483.49 area.
Previously it was reported that Berkshire Hathaway is strategically increasing its exposure to artificial intelligence and energy infrastructure through both equity investments and its utilities business. The current technical setup suggests that traders should closely monitor the $508.71 resistance level, as a sustained breakout could signal the next significant move for BRK.B shares.











-
 Afghanistan
-
 Albania
-
 Algeria
-
 Angola
-
 Argentina
-
 Armenia
-
 Australia
-
 Austria
-
 Azerbaijan
-
 Bahamas
-
 Bahrain
-
 Bangladesh
-
 Belarus
-
 Belgium
-
 Bolivia
-
 Botswana
-
 Brazil
-
 Brunei
-
 Bulgaria
-
 Cambodia
-
 Cameroon
-
 Canada
-
 Chile
-
 China
-
 Colombia
-
 Congo
-
 Costa Rica
-
 Cote d'Ivoire
-
 Croatia
-
 Cuba
-
 Cyprus
-
 Czechia
-
 DR Congo
-
 Denmark
-
 Dominican Republic
-
 Ecuador
-
 Egypt
-
 El Salvador
-
 Estonia
-
 Eswatini
-
 Ethiopia
-
 Finland
-
 France
-
 Georgia
-
 Germany
-
 Ghana
-
 Greece
-
 Haiti
-
 Hong Kong
-
 Hungary
-
 India
-
 Indonesia
-
 Iran, Islamic republic
-
 Iraq
-
 Ireland
-
 Israel
-
 Italy
-
 Jamaica
-
 Japan
-
 Jordan
-
 Kazakhstan
-
 Kenya
-
 Korea
-
 Kuwait
-
 Kyrgyzstan
-
 Laos
-
 Latvia
-
 Lebanon
-
 Lesotho
-
 Libya
-
 Lithuania
-
 Luxembourg
-
 Madagascar
-
 Malaysia
-
 Malta
-
 Mauritius
-
 Mexico
-
 Moldova
-
 Mongolia
-
 Montenegro
-
 Morocco
-
 Mozambique
-
 Myanmar
-
 Namibia
-
 Nepal
-
 Netherlands
-
 New Zealand
-
 Nigeria
-
 North Macedonia
-
 Norway
-
 Oman
-
 Pakistan
-
 Palestine
-
 Panama
-
 Papua New Guinea
-
 Paraguay
-
 Peru
-
 Philippines
-
 Poland
-
 Portugal
-
 Puerto Rico
-
 Qatar
-
 Reunion
-
 Romania
-
 Rwanda
-
 Saudi Arabia
-
 Serbia
-
 Singapore
-
 Slovakia
-
 Slovenia
-
 Somalia
-
 South Africa
-
 Spain
-
 Sri Lanka
-
 Sweden
-
 Switzerland
-
 Syria
-
 Taiwan
-
 Tajikistan
-
 Tanzania
-
 Thailand
-
 Trinidad and Tobago
-
 Tunisia
-
 Turkey
-
 UAE
-
 Uganda
-
 Ukraine
-
 United Kingdom
-
United States
-
 Uruguay
-
 Uzbekistan
-
 Venezuela
-
 Vietnam
-
 Yemen
-
 Zambia
-
 Zimbabwe
- Forex
- Crypto












