

Procter & Gamble stock weekly forecast: Sellers keep control amid persistent headwinds and muted rebound signals

Shares of The Procter & Gamble Company (PG) are trading near $143 after sliding more than 2% over the past week, with the setup remaining defensive as the stock consolidates at the low end of its recent range. High-profile earnings and guidance, along with persistent corporate headwinds, are shaping sentiment for the week ahead, keeping traders alert to further downside risk.
 165.36
Highlights
- Shares of Procter & Gamble fell 2.18% over the past week to $143.05, trading below major daily moving averages.
- The stock trades at the bottom of last week’s range with mixed momentum signals and no clearly defined immediate support.
- Forecasted range for the coming week is $140.04 to $144.66, with a 68% probability of further downside movement.
Earnings guidance and acquisition plans drive sentiment amid cost challenges
Procter & Gamble set its fiscal year 2027 earnings guidance between $6.89 and $7.11 per share, with expected fiscal 2026 earnings of around $6.99 per share, according to Ticker Report and TheMarketsDaily. The company reported fiscal 2026 revenue of INR 4,290 crore and net profit of INR 857 crore, as stated by ad-hoc-news.de, and continued its 70-year streak of annual dividend increases with a final dividend recommendation of INR 60 per share, totaling INR 255 for the year. Additionally, Seeking Alpha reported ongoing challenges for PG, including competition from private labels, cost pressures, a $1 billion after-tax headwind, and the $3.8 billion Thorne acquisition aiming to diversify growth opportunities in the coming week.
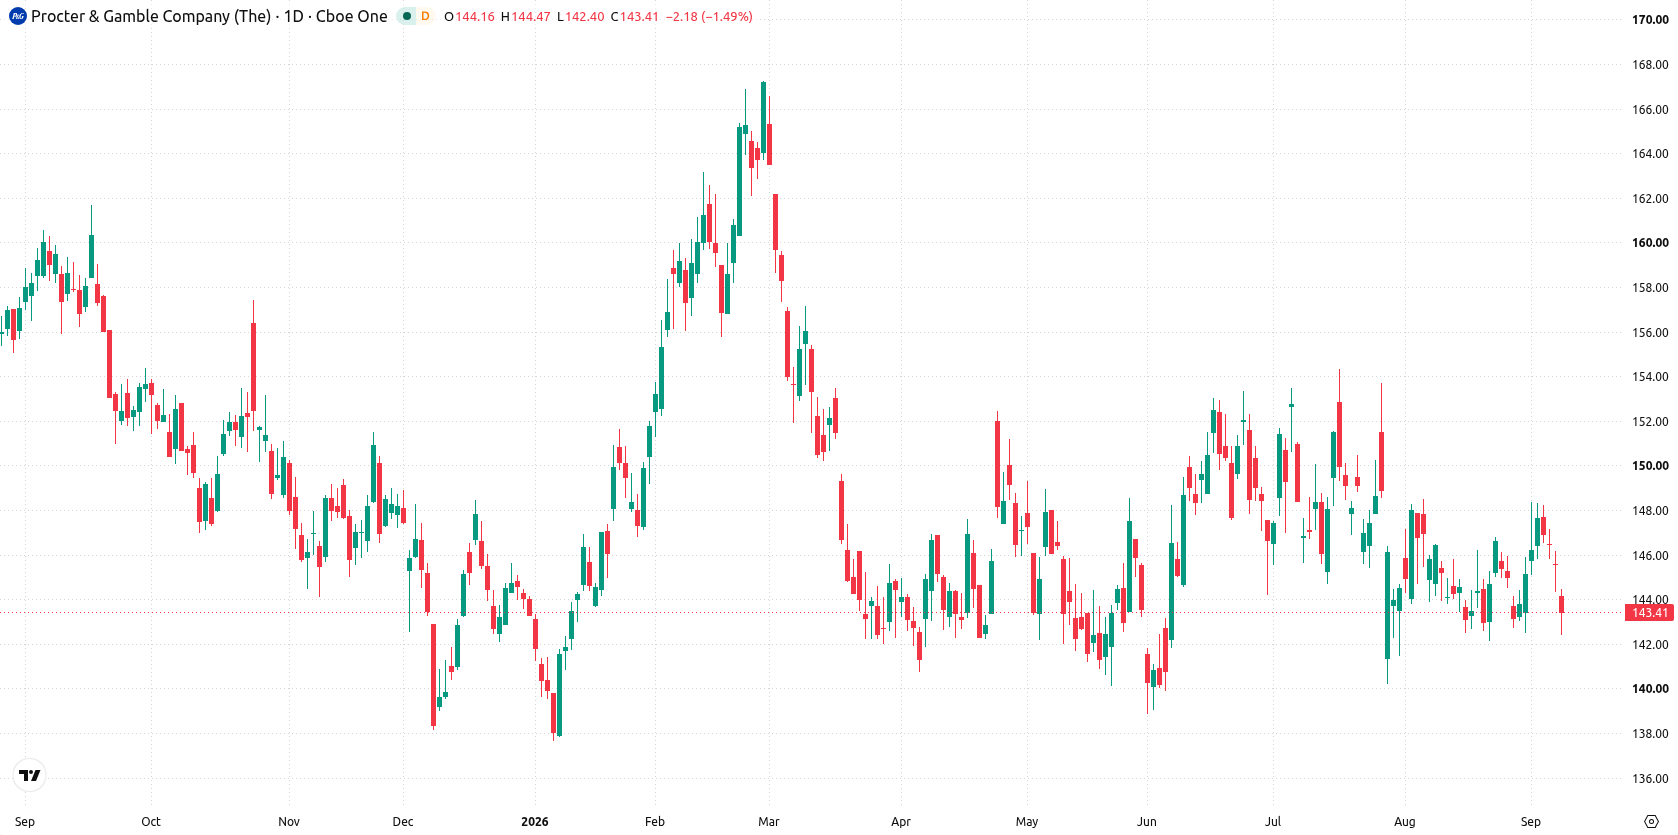
Downside bias persists as narrow range meets mixed momentum signals
The daily chart shows a contained move within a narrow range, with price pinned at the very bottom of last week’s trading band. Momentum readings are mixed: the RSI sits in a neutral zone at 49.58, while the HMA signals a bearish tilt. With volatility at 2.51%, near-term resistance appears at $144.31 and further above at the Ichimoku Kijun ($145.49), while support is not clearly defined immediately below current levels. This lack of upward follow-through, paired with stubborn moving average pressure, keeps the near-term bias tilted to the downside.
Consolidation favored next week unless key support or resistance breaks
In the week ahead, the forecasted range is $140.04 to $144.66, with a 68% probability of a move lower and a 32% chance of gains. The base case is for the stock to consolidate between $140.04 support and $144.31 resistance. A breakout above $144.31 (and the Kijun at $145.49) could open a short-term recovery scenario. Conversely, a sustained move below $140.04 would reinforce bearish momentum and likely trigger further declines within the established downtrend.
Earlier, analysts noted that Procter & Gamble was experiencing a period of consolidation with mixed technical signals and a cautious market outlook. The current consolidation at the lower end of the range, alongside ongoing corporate headwinds and lackluster price momentum, highlights $140.04 as a key support level to watch for signs of further downside or renewed stabilization.






Latest Procter & Gamble News





-
 Afghanistan
-
 Albania
-
 Algeria
-
 Angola
-
 Argentina
-
 Armenia
-
 Australia
-
 Austria
-
 Azerbaijan
-
 Bahamas
-
 Bahrain
-
 Bangladesh
-
 Belarus
-
 Belgium
-
 Bolivia
-
 Botswana
-
 Brazil
-
 Brunei
-
 Bulgaria
-
 Cambodia
-
 Cameroon
-
 Canada
-
 Chile
-
 China
-
 Colombia
-
 Congo
-
 Costa Rica
-
 Cote d'Ivoire
-
 Croatia
-
 Cuba
-
 Cyprus
-
 Czechia
-
 DR Congo
-
 Denmark
-
 Dominican Republic
-
 Ecuador
-
 Egypt
-
 El Salvador
-
 Estonia
-
 Eswatini
-
 Ethiopia
-
 Finland
-
 France
-
 Georgia
-
 Germany
-
 Ghana
-
 Greece
-
 Haiti
-
 Hong Kong
-
 Hungary
-
 India
-
 Indonesia
-
 Iran, Islamic republic
-
 Iraq
-
 Ireland
-
 Israel
-
 Italy
-
 Jamaica
-
 Japan
-
 Jordan
-
 Kazakhstan
-
 Kenya
-
 Korea
-
 Kuwait
-
 Kyrgyzstan
-
 Laos
-
 Latvia
-
 Lebanon
-
 Lesotho
-
 Libya
-
 Lithuania
-
 Luxembourg
-
 Madagascar
-
 Malaysia
-
 Malta
-
 Mauritius
-
 Mexico
-
 Moldova
-
 Mongolia
-
 Montenegro
-
 Morocco
-
 Mozambique
-
 Myanmar
-
 Namibia
-
 Nepal
-
 Netherlands
-
 New Zealand
-
 Nigeria
-
 North Macedonia
-
 Norway
-
 Oman
-
 Pakistan
-
 Palestine
-
 Panama
-
 Papua New Guinea
-
 Paraguay
-
 Peru
-
 Philippines
-
 Poland
-
 Portugal
-
 Puerto Rico
-
 Qatar
-
 Reunion
-
 Romania
-
 Rwanda
-
 Saudi Arabia
-
 Serbia
-
 Singapore
-
 Slovakia
-
 Slovenia
-
 Somalia
-
 South Africa
-
 Spain
-
 Sri Lanka
-
 Sweden
-
 Switzerland
-
 Syria
-
 Taiwan
-
 Tajikistan
-
 Tanzania
-
 Thailand
-
 Trinidad and Tobago
-
 Tunisia
-
 Turkey
-
 UAE
-
 Uganda
-
 Ukraine
-
 United Kingdom
-
United States
-
 Uruguay
-
 Uzbekistan
-
 Venezuela
-
 Vietnam
-
 Yemen
-
 Zambia
-
 Zimbabwe
- Forex
- Crypto












