


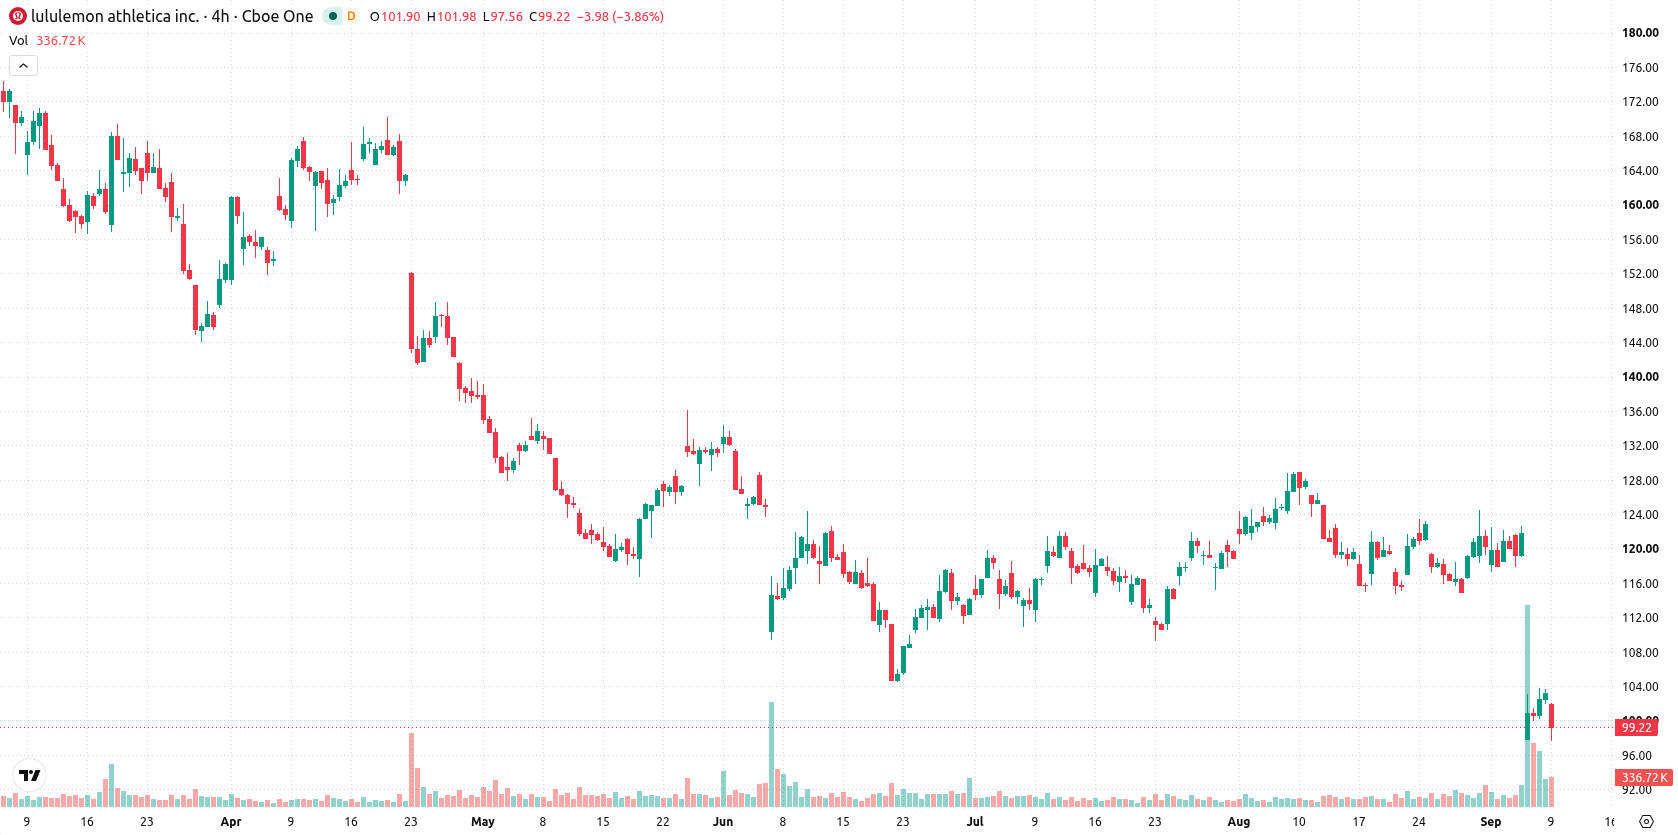
Lululemon Athletica Inc. (LULU) fell 3.71% today after recent quarterly results and guidance cuts highlighted ongoing weakness in core categories and regional performance. The slide is reinforced by the stock's position well below key moving averages, confirming broad selling pressure across the short, medium, and long term.
 100.44
100.44
100.44
Highlights
- Lululemon stock fell after quarterly revenue declined 4% to $2.42 billion and comparable sales dropped 9%.
- Core leggings sales declined about 20%, Americas revenue dropped 8%, and full-year 2025 revenue guidance was twice lowered to $10.35 to $10.50 billion.
- Shares last traded at $99.04 with persistent bearish pressure, oversold momentum signals, and a five-day projected range of $86.98 to $111.1.
Core leggings and Americas losses drive guidance cuts, new CEO faces headwinds
Lululemon Athletica reported a 4% year-over-year decline in revenue to $2.42 billion for the second quarter, alongside a 9% drop in comparable sales. Sales in the core leggings category fell by approximately 20%, and revenue from the Americas region decreased by 8%. The company twice lowered its full-year 2025 revenue guidance to a range of $10.35–$10.50 billion following these results. Heidi O'Neill began her tenure as CEO on September 8, inheriting these challenges and slower international growth.
Bear trend intensifies as stock breaks support and oversold signals flash
Lululemon is trading well below its 20-day ($117.68), 50-day ($118.11), and 200-day ($152.47) moving averages, indicating decisive pressure from sellers over all observed periods. The broader trend remains bearish, with the Ichimoku Kijun ($113.52) acting as distant overhead resistance. The immediate trading corridor is contained between a ceiling at $101.84 and support at $98.19. Momentum indicators reinforce the negative picture: MACD is in Sell territory, ADX shows a weak trend, and RSI, Stochastic RSI, and CCI all signal oversold conditions. Bull/Bear Power readings are deeply negative, highlighting clear intraday seller dominance and warning of an oversold status. The stock last traded at $99.04 following a downside gap of about 0.99%. Current intraday volatility is at 4.30%, with persistent pressure after the opening that matches broader momentum signals.
Earlier, analysts noted Lululemon’s persistent operational and stock price challenges despite its strong brand profile and attempts at regaining momentum. The latest data reinforce this bearish structural picture, with oversold momentum indicators signaling elevated downside risk and making a potential breakdown below $98.19 an important level for traders to monitor in the coming sessions.





Latest Lululemon Athletica News






-
 Afghanistan
-
 Albania
-
 Algeria
-
 Angola
-
 Argentina
-
 Armenia
-
 Australia
-
 Austria
-
 Azerbaijan
-
 Bahamas
-
 Bahrain
-
 Bangladesh
-
 Belarus
-
 Belgium
-
 Bolivia
-
 Botswana
-
 Brazil
-
 Brunei
-
 Bulgaria
-
 Cambodia
-
 Cameroon
-
 Canada
-
 Chile
Chile
-
 China
China
-
 Colombia
-
 Congo
Congo
-
 Costa Rica
-
 Cote d'Ivoire
-
 Croatia
-
 Cuba
Cuba
-
 Cyprus
-
 Czechia
-
 DR Congo
-
 Denmark
-
 Dominican Republic
-
 Ecuador
-
 Egypt
Egypt
-
 El Salvador
-
 Estonia
-
 Eswatini
-
 Ethiopia
-
 Finland
-
 France
-
 Georgia
-
 Germany
-
 Ghana
Ghana
-
 Greece
-
 Haiti
Haiti
-
 Hong Kong
-
 Hungary
-
 India
India
-
 Indonesia
-
 Iran, Islamic republic
-
 Iraq
Iraq
-
 Ireland
-
 Israel
-
 Italy
Italy
-
 Jamaica
-
 Japan
Japan
-
 Jordan
-
 Kazakhstan
-
 Kenya
Kenya
-
 Korea
Korea
-
 Kuwait
-
 Kyrgyzstan
-
 Laos
Laos
-
 Latvia
-
 Lebanon
-
 Lesotho
-
 Libya
Libya
-
 Lithuania
-
 Luxembourg
-
 Madagascar
-
 Malaysia
-
 Malta
Malta
-
 Mauritius
-
 Mexico
-
 Moldova
-
 Mongolia
-
 Montenegro
-
 Morocco
-
 Mozambique
-
 Myanmar
-
 Namibia
-
 Nepal
Nepal
-
 Netherlands
-
 New Zealand
-
 Nigeria
-
 North Macedonia
-
 Norway
-
 Oman
Oman
-
 Pakistan
-
 Palestine
-
 Panama
-
 Papua New Guinea
-
 Paraguay
-
 Peru
Peru
-
 Philippines
-
 Poland
-
 Portugal
-
 Puerto Rico
-
 Qatar
Qatar
-
 Reunion
-
 Romania
-
 Rwanda
-
 Saudi Arabia
-
 Serbia
-
 Singapore
-
 Slovakia
-
 Slovenia
-
 Somalia
-
 South Africa
-
 Spain
Spain
-
 Sri Lanka
-
 Sweden
-
 Switzerland
-
 Syria
Syria
-
 Taiwan
-
 Tajikistan
-
 Tanzania
-
 Thailand
-
 Trinidad and Tobago
-
 Tunisia
-
 Turkey
-
 UAE
UAE
-
 Uganda
-
 Ukraine
-
 United Kingdom
-
United States
-
 Uruguay
-
 Uzbekistan
-
 Venezuela
-
 Vietnam
-
 Yemen
Yemen
-
 Zambia
-
 Zimbabwe
- Forex
- Crypto












