

SOFI slides over 3% as price action signals ongoing seller dominance despite upbeat results

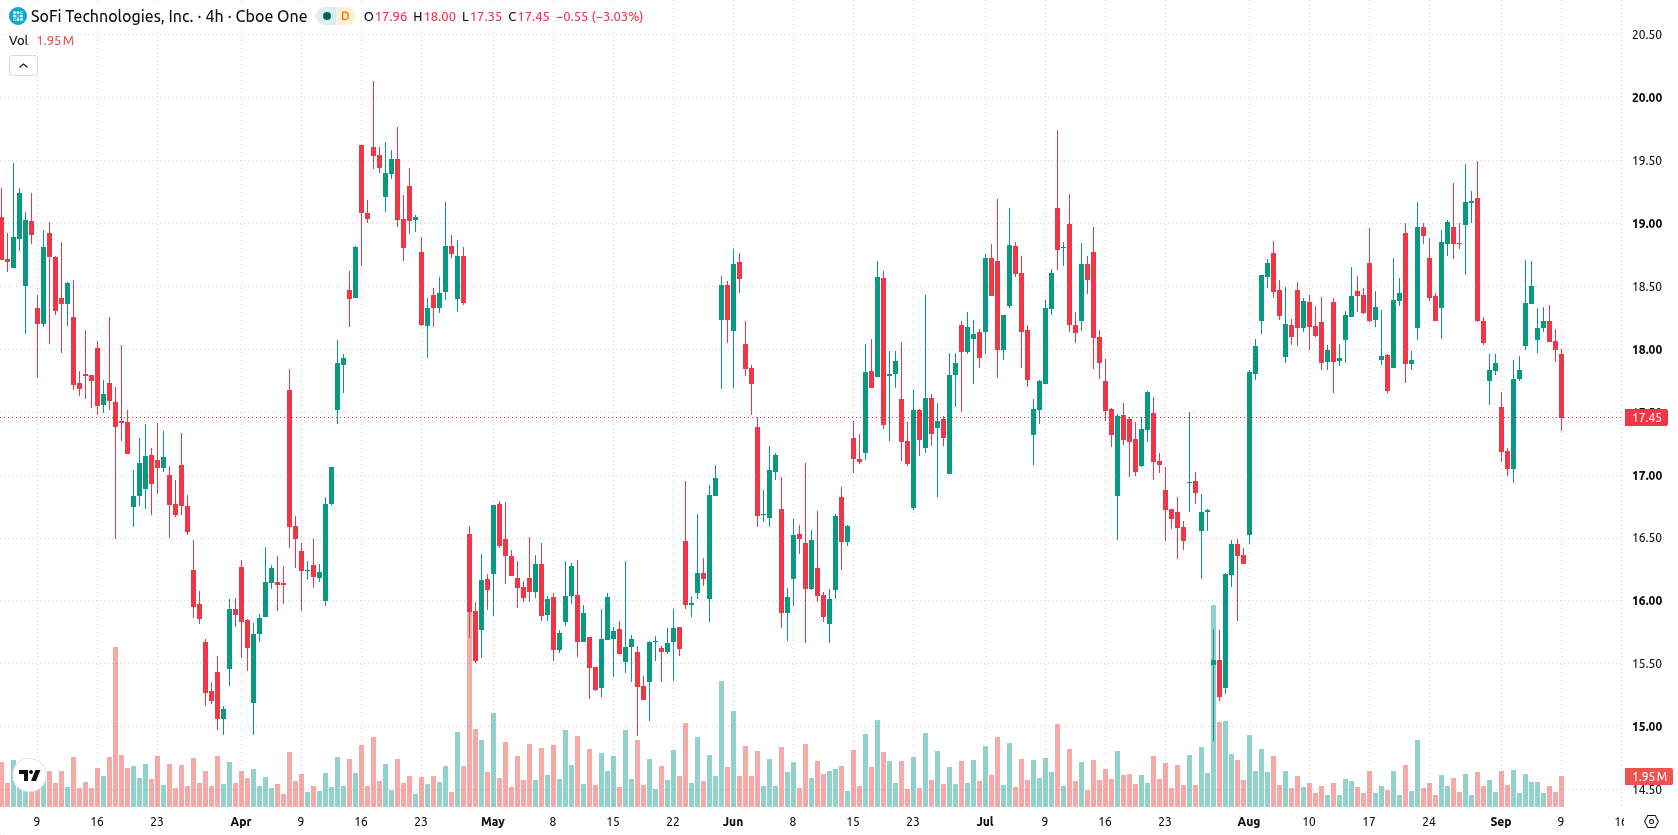
SoFi Technologies, Inc. (SOFI) fell 3.16% today, with selling pressure emerging even as the company reported stronger-than-expected second-quarter earnings and a major partnership with Kraken. The downside move is supported by SoFi trading below its 20-, 50-, and 200-day moving averages, confirming persistent seller dominance across all timeframes.
 16.97
17.63
Highlights
- SoFi stock exceeded consensus with second-quarter adjusted earnings of $0.12 per share and $1.2 billion in revenue.
- Membership grew by 1.1 million, total product additions reached 2.2 million, and SoFi surpassed 200,000 SoFi Plus subscribers.
- Shares of SoFi currently trade under near-term moving averages with a projected five-day range of $16.78 to $17.85 as downside probability stands at 60%.
Revenue and subscriber growth outpace estimates amid relentless sell-off
SoFi reported second-quarter adjusted earnings of $0.12 per share on revenue of $1.2 billion, both exceeding Wall Street estimates. The company added 1.1 million members in the latest quarter, along with 2.2 million new product additions and surpassed 200,000 paying SoFi Plus subscribers. A partnership was entered with Payward, parent of Kraken, integrating SoFi's banking and stablecoin offerings with Kraken’s platform, and new brand sponsorships were also announced, including a deal with Notre Dame. These developments were accompanied by continued revenue growth, though price action has remained under broader selling pressure.
Mixed momentum signals emerge as technical barriers confine downside
SoFi is trading below its 20-day ($18.23), 50-day ($17.88), and 200-day ($19.93) moving averages, indicating seller pressure across short-, medium-, and long-term trends. The nearest support is the near-term floor at $16.78, while resistance sits just above at the near-term ceiling of $17.62, with the 50-day moving average confirming a bearish long-term alignment. Momentum readings are mixed: MACD gives a strong buy signal, but the Average Directional Index (ADX) is neutral, pointing to a lack of clear trend strength. The Relative Strength Index (RSI) at 49.64 and Stochastic RSI at 43.15 both forecast selling, just above oversold territory, while the Commodity Channel Index (CCI) is neutral. Bull/Bear Power (BBP) at 0.2 suggests buyers hold slight dominance intraday. The price is down $0.57 or 3.16% today following a downside gap of about 0.56%, trading near its session low. Intraday volatility stands at 1.70% and the tone reflects ongoing pressure after the open. These signals diverge, with MACD implying a potential reversal yet most oscillators and price action still indicating downside momentum.
Earlier, analysts noted that persistent technical weakness and downside risk were dominating SoFi’s trading outlook despite positive business developments. The current setup reinforces this cautious stance, with price action still under pressure and traders advised to closely monitor the $16.78 support for signs of further downside or stabilization.










-
 Afghanistan
-
 Albania
-
 Algeria
-
 Angola
-
 Argentina
-
 Armenia
-
 Australia
-
 Austria
-
 Azerbaijan
-
 Bahamas
-
 Bahrain
-
 Bangladesh
-
 Belarus
-
 Belgium
-
 Bolivia
-
 Botswana
-
 Brazil
-
 Brunei
-
 Bulgaria
-
 Cambodia
-
 Cameroon
-
 Canada
-
 Chile
-
 China
-
 Colombia
-
 Congo
-
 Costa Rica
-
 Cote d'Ivoire
-
 Croatia
-
 Cuba
-
 Cyprus
-
 Czechia
-
 DR Congo
-
 Denmark
-
 Dominican Republic
-
 Ecuador
-
 Egypt
-
 El Salvador
-
 Estonia
-
 Eswatini
-
 Ethiopia
-
 Finland
-
 France
-
 Georgia
-
 Germany
-
 Ghana
-
 Greece
-
 Haiti
-
 Hong Kong
-
 Hungary
-
 India
-
 Indonesia
-
 Iran, Islamic republic
-
 Iraq
-
 Ireland
-
 Israel
-
 Italy
-
 Jamaica
-
 Japan
-
 Jordan
-
 Kazakhstan
-
 Kenya
-
 Korea
-
 Kuwait
-
 Kyrgyzstan
-
 Laos
-
 Latvia
-
 Lebanon
-
 Lesotho
-
 Libya
-
 Lithuania
-
 Luxembourg
-
 Madagascar
-
 Malaysia
-
 Malta
-
 Mauritius
-
 Mexico
-
 Moldova
-
 Mongolia
-
 Montenegro
-
 Morocco
-
 Mozambique
-
 Myanmar
-
 Namibia
-
 Nepal
-
 Netherlands
-
 New Zealand
-
 Nigeria
-
 North Macedonia
-
 Norway
-
 Oman
-
 Pakistan
-
 Palestine
-
 Panama
-
 Papua New Guinea
-
 Paraguay
-
 Peru
-
 Philippines
-
 Poland
-
 Portugal
-
 Puerto Rico
-
 Qatar
-
 Reunion
-
 Romania
-
 Rwanda
-
 Saudi Arabia
-
 Serbia
-
 Singapore
-
 Slovakia
-
 Slovenia
-
 Somalia
-
 South Africa
-
 Spain
-
 Sri Lanka
-
 Sweden
-
 Switzerland
-
 Syria
-
 Taiwan
-
 Tajikistan
-
 Tanzania
-
 Thailand
-
 Trinidad and Tobago
-
 Tunisia
-
 Turkey
-
 UAE
-
 Uganda
-
 Ukraine
-
 United Kingdom
-
United States
-
 Uruguay
-
 Uzbekistan
-
 Venezuela
-
 Vietnam
-
 Yemen
-
 Zambia
-
 Zimbabwe
- Forex
- Crypto












