

SoFi shares technical analysis: Weak momentum weighs on near-term outlook

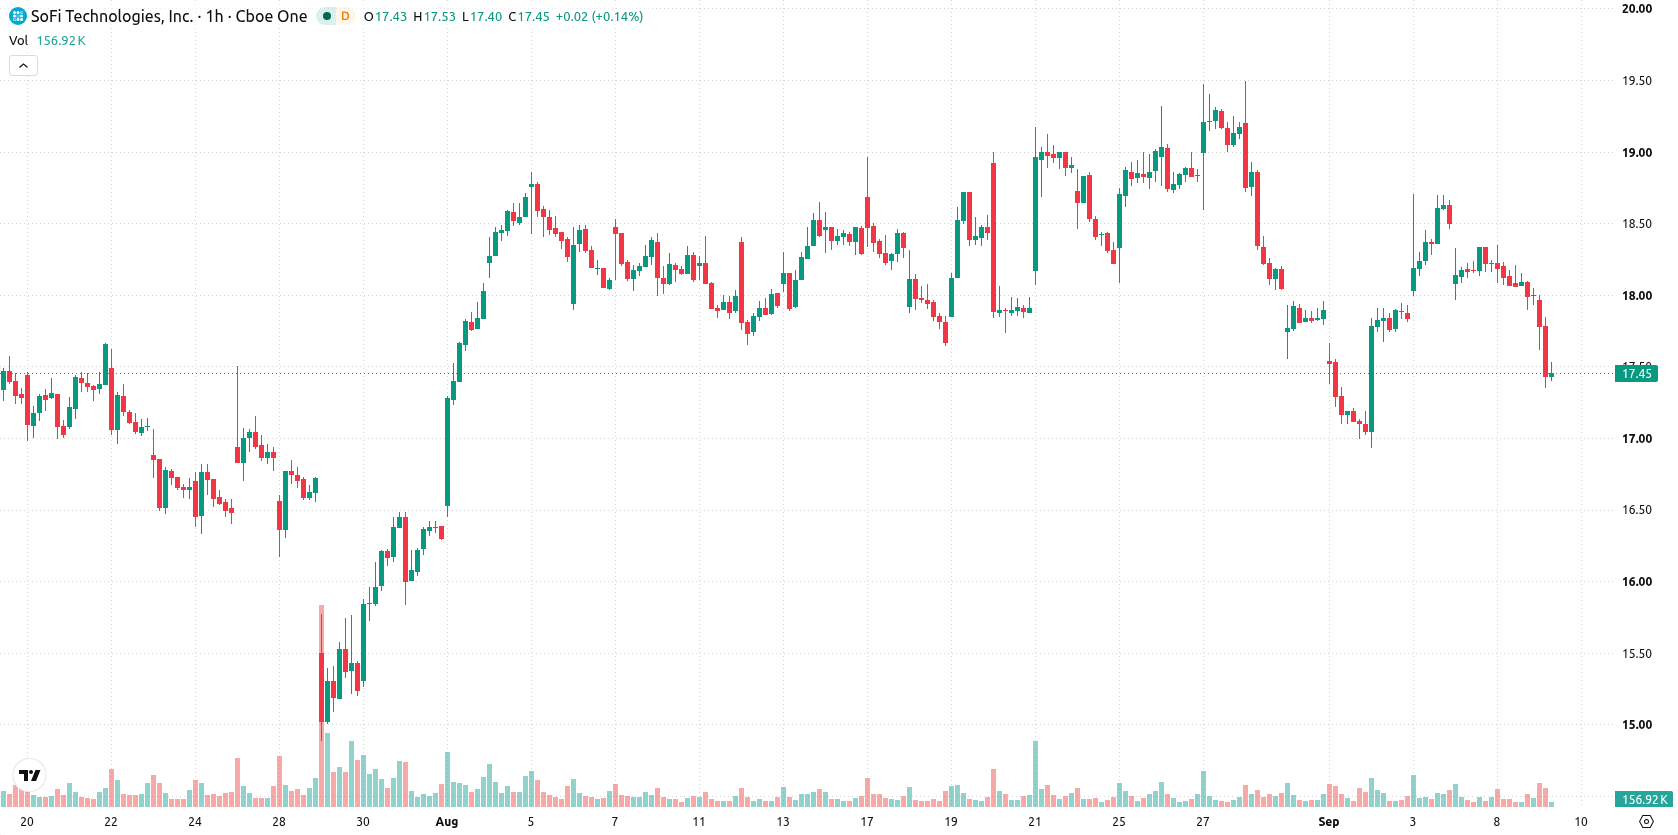
SoFi (SOFI) stock is trading at $17.5, down 2.86% for the session and near its daily low. The price currently sits below its key moving averages, indicating lingering selling pressure.
 17.60
17.63
Highlights
- SoFi Technologies reported about 40% year-over-year revenue growth for both Q1 and Q2 2026 and nearly 30% adjusted EBITDA margins.
- Management raised full-year revenue guidance, incorporating one to two interest-rate hikes, as member engagement and product adoption accelerated.
- Shares of SoFi trade below key moving averages with bearish momentum, and the expected short-term range is $17.14 to $17.86 as downward pressure persists.
Raised revenue outlook offsets interest-rate risks amid bearish trade
SoFi Technologies reported approximately 40% year-over-year revenue growth in each of the first two quarters of 2026, with adjusted EBITDA margins near 30%, as confirmed at an investor conference on September 8, 2026. Management also raised full-year revenue guidance despite factoring in one to two interest-rate hikes, according to Investing.com, reflecting strong underlying business momentum. Accelerating member engagement and product adoption further support SoFi's platform growth and monetization prospects, though price action has remained under broader selling pressure.
Bearish momentum and oversold signals as resistance caps rebound
SOFI is trading below the MA-20 at $18.12 and MA-50 at $17.93 on the hourly chart, and well under the MA-200 at $19.93 on the daily chart. The Ichimoku Kijun stands at $18.04, acting as immediate resistance. Momentum indicators remain bearish: MACD shows a sell bias, while ADX signals neutral trend strength. RSI reads 30.75 and, together with Stochastic RSI and CCI, indicates oversold conditions. Bull/Bear Power highlights sellers in control of intraday momentum, and the Awesome Oscillator remains neutral, suggesting no reinforcement of the prevailing trend. The mix of oversold oscillator signals and persistent bearish momentum reflects a divergence, as intraday action aligns with strong selling.
Downside risk heightened as rebound prospects remain limited
Over the next several days, SOFI is expected to trade within a volatility band of $17.14 to $17.86. The probability of a rebound is very low, while further downside risk remains elevated; a significant recovery scenario would require a strong move above immediate resistance levels. If support falters near the lower band, bearish continuation is likely, with the baseline outlook favoring sideways to lower price action within the established range.
Earlier, analysts noted that SoFi’s partnership initiatives and expanding digital-asset exposure positioned the stock for a potential upside breakout. However, with persistent technical weakness and lingering downside risk dominating the current setup, traders should closely watch the $17.14 support level for signs of either stabilization or further bearish continuation.










-
 Afghanistan
-
 Albania
-
 Algeria
-
 Angola
-
 Argentina
-
 Armenia
-
 Australia
-
 Austria
-
 Azerbaijan
-
 Bahamas
-
 Bahrain
-
 Bangladesh
-
 Belarus
-
 Belgium
-
 Bolivia
-
 Botswana
-
 Brazil
-
 Brunei
-
 Bulgaria
-
 Cambodia
-
 Cameroon
-
 Canada
-
 Chile
-
 China
-
 Colombia
-
 Congo
-
 Costa Rica
-
 Cote d'Ivoire
-
 Croatia
-
 Cuba
-
 Cyprus
-
 Czechia
-
 DR Congo
-
 Denmark
-
 Dominican Republic
-
 Ecuador
-
 Egypt
-
 El Salvador
-
 Estonia
-
 Eswatini
-
 Ethiopia
-
 Finland
-
 France
-
 Georgia
-
 Germany
-
 Ghana
-
 Greece
-
 Haiti
-
 Hong Kong
-
 Hungary
-
 India
-
 Indonesia
-
 Iran, Islamic republic
-
 Iraq
-
 Ireland
-
 Israel
-
 Italy
-
 Jamaica
-
 Japan
-
 Jordan
-
 Kazakhstan
-
 Kenya
-
 Korea
-
 Kuwait
-
 Kyrgyzstan
-
 Laos
-
 Latvia
-
 Lebanon
-
 Lesotho
-
 Libya
-
 Lithuania
-
 Luxembourg
-
 Madagascar
-
 Malaysia
-
 Malta
-
 Mauritius
-
 Mexico
-
 Moldova
-
 Mongolia
-
 Montenegro
-
 Morocco
-
 Mozambique
-
 Myanmar
-
 Namibia
-
 Nepal
-
 Netherlands
-
 New Zealand
-
 Nigeria
-
 North Macedonia
-
 Norway
-
 Oman
-
 Pakistan
-
 Palestine
-
 Panama
-
 Papua New Guinea
-
 Paraguay
-
 Peru
-
 Philippines
-
 Poland
-
 Portugal
-
 Puerto Rico
-
 Qatar
-
 Reunion
-
 Romania
-
 Rwanda
-
 Saudi Arabia
-
 Serbia
-
 Singapore
-
 Slovakia
-
 Slovenia
-
 Somalia
-
 South Africa
-
 Spain
-
 Sri Lanka
-
 Sweden
-
 Switzerland
-
 Syria
-
 Taiwan
-
 Tajikistan
-
 Tanzania
-
 Thailand
-
 Trinidad and Tobago
-
 Tunisia
-
 Turkey
-
 UAE
-
 Uganda
-
 Ukraine
-
 United Kingdom
-
United States
-
 Uruguay
-
 Uzbekistan
-
 Venezuela
-
 Vietnam
-
 Yemen
-
 Zambia
-
 Zimbabwe
- Forex
- Crypto












