

TPG stock falls over 3% as technical selling pressure dominates

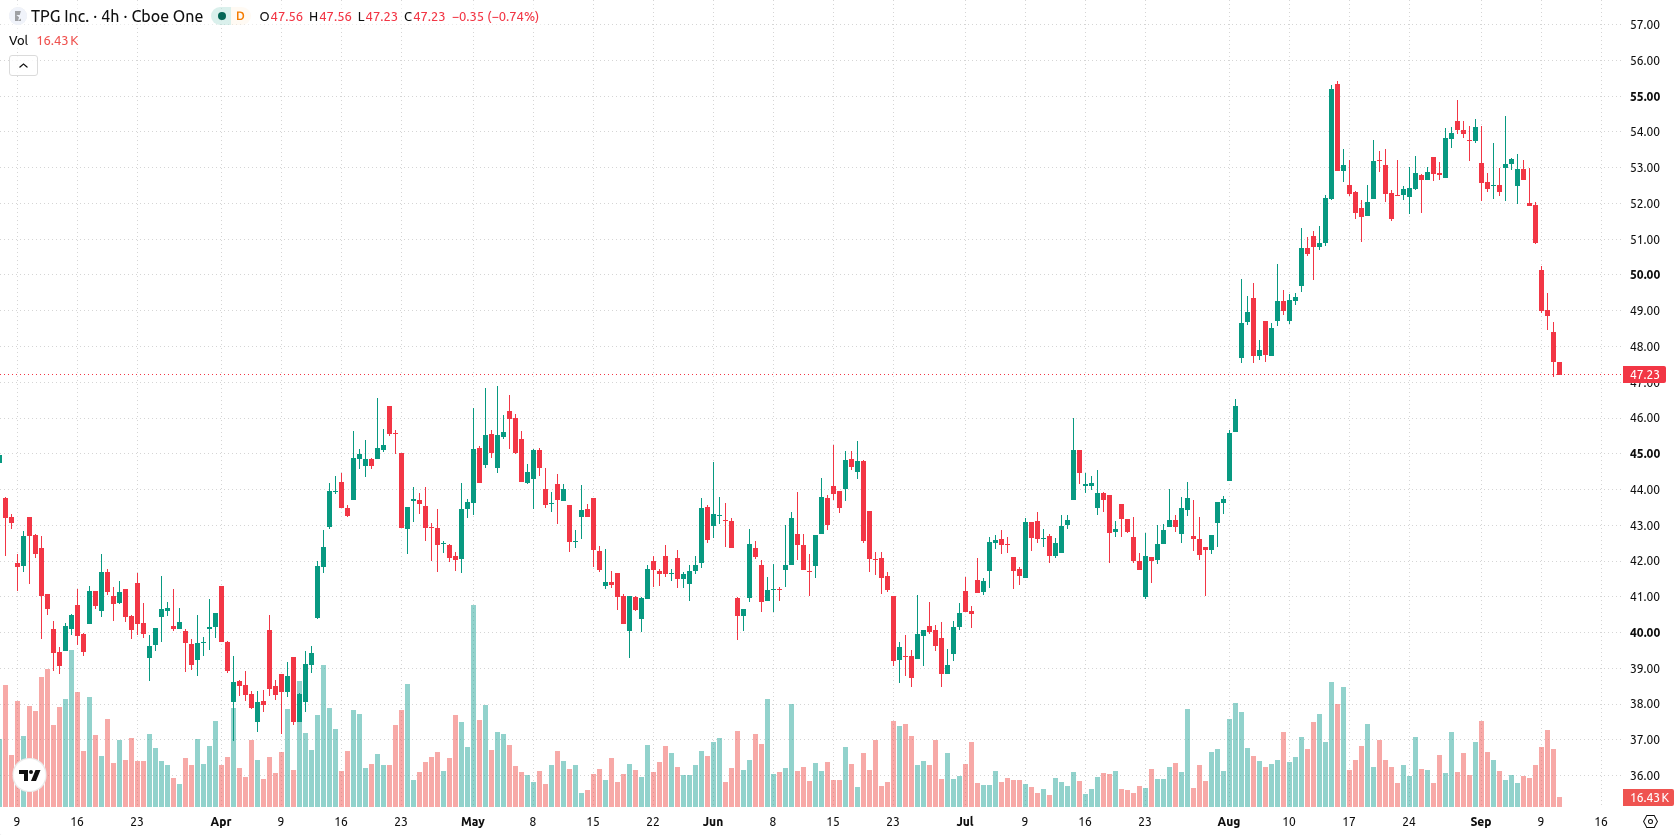
Continued technical selling pressure drove TPG Inc (TPG) down 3.31% today, with momentum deeply negative across all key short-term and long-term indicators. The depth of the decline is reinforced by TPG remaining below its 20-day, 50-day, and 200-day moving averages, as sellers maintain control over price action.
 47.98
45.83
Highlights
- TPG stock trades below key short and long-term moving averages, confirming a bearish trend with persistent selling pressure.
- Momentum indicators are mixed, with some forecasting potential for a short-term counter-trend move as sellers show signs of exhaustion.
- The projected five-session range is $44.84 to $49.74, with key resistance at $47.44 and support at $44.84.
Mixed momentum as technical signals hint at possible reversal
TPG is currently trading below its 20-day, 50-day, and 200-day moving averages ($52.55, $47.44, and $49.1, respectively), indicating continued pressure from sellers across all observed timeframes. The nearest resistance is the 50-day moving average at $47.44, with a floor set at the session low of $47.16, while the longer-term trend context remains bearish according to the 50-day versus 200-day alignment. Momentum indicators are mixed: the Moving Average Convergence Divergence (MACD) and Average Directional Index (ADX) both forecast buy signals, suggesting underlying potential for a counter-trend move. Relative Strength Index (RSI) is weak at 42.91 and both Commodity Channel Index (CCI) and Stochastic RSI register oversold, highlighting potential exhaustion among sellers. Bull/Bear Power (BBP) is negative at -1.44, confirming sellers currently dominate and reinforcing the oversold call. The stock has dropped to $47.29, down 3.31% for the session, and opened with a downside gap of roughly $0.33 or 0.67%. Price action is near session lows with volatility amplitude at 3.24%. The intraday tone is under pressure in line with dominant momentum signals, although some indicators point to possible stabilization if buyers step in.
Previously it was reported that TPG was trading within a narrow range, with technical indicators highlighting overbought conditions and the potential for increased volatility. The latest decline and oversold signals confirm a shift in trend, making the $47.44 resistance and $44.84 support critical levels to watch for possible breakout or further downside risk in the coming sessions.










-
 Afghanistan
-
 Albania
-
 Algeria
-
 Angola
-
 Argentina
-
 Armenia
-
 Australia
-
 Austria
-
 Azerbaijan
-
 Bahamas
-
 Bahrain
-
 Bangladesh
-
 Belarus
-
 Belgium
-
 Bolivia
-
 Botswana
-
 Brazil
-
 Brunei
-
 Bulgaria
-
 Cambodia
-
 Cameroon
-
 Canada
-
 Chile
-
 China
-
 Colombia
-
 Congo
-
 Costa Rica
-
 Cote d'Ivoire
-
 Croatia
-
 Cuba
-
 Cyprus
-
 Czechia
-
 DR Congo
-
 Denmark
-
 Dominican Republic
-
 Ecuador
-
 Egypt
-
 El Salvador
-
 Estonia
-
 Eswatini
-
 Ethiopia
-
 Finland
-
 France
-
 Georgia
-
 Germany
-
 Ghana
-
 Greece
-
 Haiti
-
 Hong Kong
-
 Hungary
-
 India
-
 Indonesia
-
 Iran, Islamic republic
-
 Iraq
-
 Ireland
-
 Israel
-
 Italy
-
 Jamaica
-
 Japan
-
 Jordan
-
 Kazakhstan
-
 Kenya
-
 Korea
-
 Kuwait
-
 Kyrgyzstan
-
 Laos
-
 Latvia
-
 Lebanon
-
 Lesotho
-
 Libya
-
 Lithuania
-
 Luxembourg
-
 Madagascar
-
 Malaysia
-
 Malta
-
 Mauritius
-
 Mexico
-
 Moldova
-
 Mongolia
-
 Montenegro
-
 Morocco
-
 Mozambique
-
 Myanmar
-
 Namibia
-
 Nepal
-
 Netherlands
-
 New Zealand
-
 Nigeria
-
 North Macedonia
-
 Norway
-
 Oman
-
 Pakistan
-
 Palestine
-
 Panama
-
 Papua New Guinea
-
 Paraguay
-
 Peru
-
 Philippines
-
 Poland
-
 Portugal
-
 Puerto Rico
-
 Qatar
-
 Reunion
-
 Romania
-
 Rwanda
-
 Saudi Arabia
-
 Serbia
-
 Singapore
-
 Slovakia
-
 Slovenia
-
 Somalia
-
 South Africa
-
 Spain
-
 Sri Lanka
-
 Sweden
-
 Switzerland
-
 Syria
-
 Taiwan
-
 Tajikistan
-
 Tanzania
-
 Thailand
-
 Trinidad and Tobago
-
 Tunisia
-
 Turkey
-
 UAE
-
 Uganda
-
 Ukraine
-
 United Kingdom
-
United States
-
 Uruguay
-
 Uzbekistan
-
 Venezuela
-
 Vietnam
-
 Yemen
-
 Zambia
-
 Zimbabwe
- Forex
- Crypto












