

Breakout attempt at $272.08 resistance: Can Texas Instruments stock extend gains?

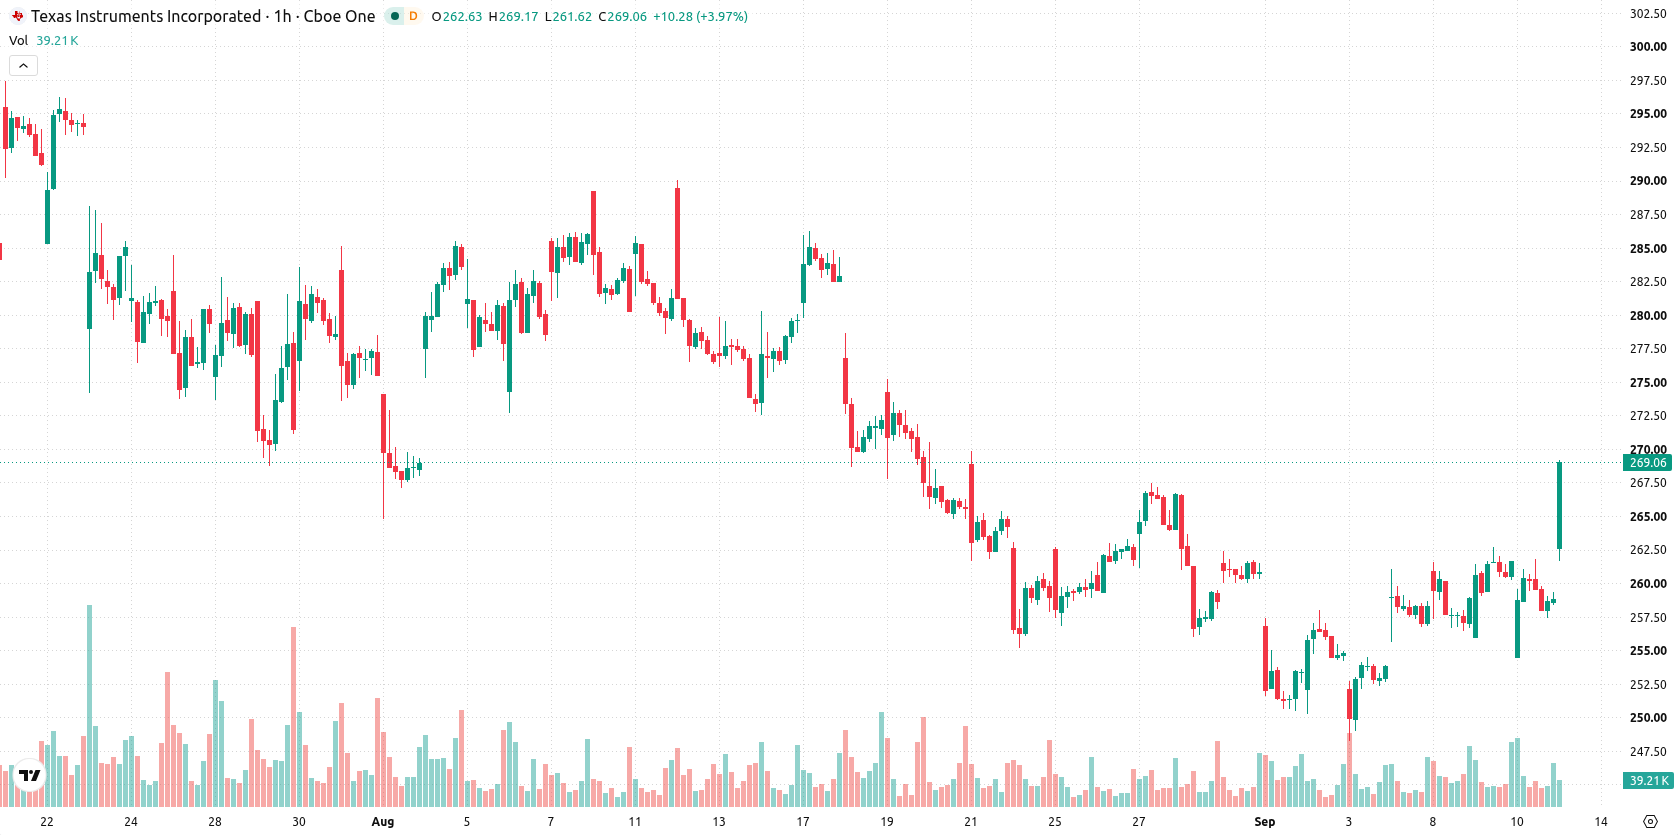
Texas Instruments (TXN) stock is trading at $268.99, up 3.93% on the day. The price sits well above its key moving averages, reflecting strong momentum compared to recent trends.
 312.98
Highlights
- TXN/USD trades in a bullish structure above key moving averages across all observed timeframes.
- Mixed signals from momentum indicators show strong buying from MACD but selling pressure from RSI and oversold conditions from Stoch RSI.
- Expected price range for the coming sessions is $261.76 to $272.08, with a high probability of further gains.
Bullish structure holds as oscillators diverge on momentum quality
On the H1 chart, TXN is trading decisively above the MA-20 at $259.47, the MA-50 at $256.85, and the long-term MA-200 at $240.93, reinforcing the bullish structure across multiple timeframes. The Ichimoku Kijun level at $259.13 establishes immediate support, while intraday momentum is mixed: MACD shows a strong buy, ADX is neutral, and RSI signals sell at 49.95. Stoch RSI and Bull/Bear Power indicate oversold conditions, with CCI and Awesome Oscillator both neutral. This divergence among oscillators and momentum indicators suggests a lack of unified conviction in the current rally.
Upside scenario favored as volatility range sets directional risk
Looking ahead, TXN is likely to fluctuate between $261.76 and $272.08 over the next several sessions. The probability of an upward move is very high, with a less likely chance of a downward correction. The base scenario anticipates the price trading within this forecast band. Should TXN break above the upper boundary, it may chart new highs, while a fall below immediate support could trigger a move toward the lower end of the volatility range.
Earlier, analysts noted that demand for chips in the AI sector was driving significant growth across major semiconductor players. The current bullish momentum in Texas Instruments stock, despite mixed signals from technical indicators, highlights the need to closely watch for a breakout above $272.08 as a signal for further upside in the near term.






Latest Texas Instruments News




-
 Afghanistan
-
 Albania
-
 Algeria
-
 Angola
-
 Argentina
-
 Armenia
-
 Australia
-
 Austria
-
 Azerbaijan
-
 Bahamas
-
 Bahrain
-
 Bangladesh
-
 Belarus
-
 Belgium
-
 Bolivia
-
 Botswana
-
 Brazil
-
 Brunei
-
 Bulgaria
-
 Cambodia
-
 Cameroon
-
 Canada
-
 Chile
-
 China
-
 Colombia
-
 Congo
-
 Costa Rica
-
 Cote d'Ivoire
-
 Croatia
-
 Cuba
-
 Cyprus
-
 Czechia
-
 DR Congo
-
 Denmark
-
 Dominican Republic
-
 Ecuador
-
 Egypt
-
 El Salvador
-
 Estonia
-
 Eswatini
-
 Ethiopia
-
 Finland
-
 France
-
 Georgia
-
 Germany
-
 Ghana
-
 Greece
-
 Haiti
-
 Hong Kong
-
 Hungary
-
 India
-
 Indonesia
-
 Iran, Islamic republic
-
 Iraq
-
 Ireland
-
 Israel
-
 Italy
-
 Jamaica
-
 Japan
-
 Jordan
-
 Kazakhstan
-
 Kenya
-
 Korea
-
 Kuwait
-
 Kyrgyzstan
-
 Laos
-
 Latvia
-
 Lebanon
-
 Lesotho
-
 Libya
-
 Lithuania
-
 Luxembourg
-
 Madagascar
-
 Malaysia
-
 Malta
-
 Mauritius
-
 Mexico
-
 Moldova
-
 Mongolia
-
 Montenegro
-
 Morocco
-
 Mozambique
-
 Myanmar
-
 Namibia
-
 Nepal
-
 Netherlands
-
 New Zealand
-
 Nigeria
-
 North Macedonia
-
 Norway
-
 Oman
-
 Pakistan
-
 Palestine
-
 Panama
-
 Papua New Guinea
-
 Paraguay
-
 Peru
-
 Philippines
-
 Poland
-
 Portugal
-
 Puerto Rico
-
 Qatar
-
 Reunion
-
 Romania
-
 Rwanda
-
 Saudi Arabia
-
 Serbia
-
 Singapore
-
 Slovakia
-
 Slovenia
-
 Somalia
-
 South Africa
-
 Spain
-
 Sri Lanka
-
 Sweden
-
 Switzerland
-
 Syria
-
 Taiwan
-
 Tajikistan
-
 Tanzania
-
 Thailand
-
 Trinidad and Tobago
-
 Tunisia
-
 Turkey
-
 UAE
-
 Uganda
-
 Ukraine
-
 United Kingdom
-
United States
-
 Uruguay
-
 Uzbekistan
-
 Venezuela
-
 Vietnam
-
 Yemen
-
 Zambia
-
 Zimbabwe
- Forex
- Crypto












