

Costco shares weekly forecast: Rebound chances capped by resistance at $899.08

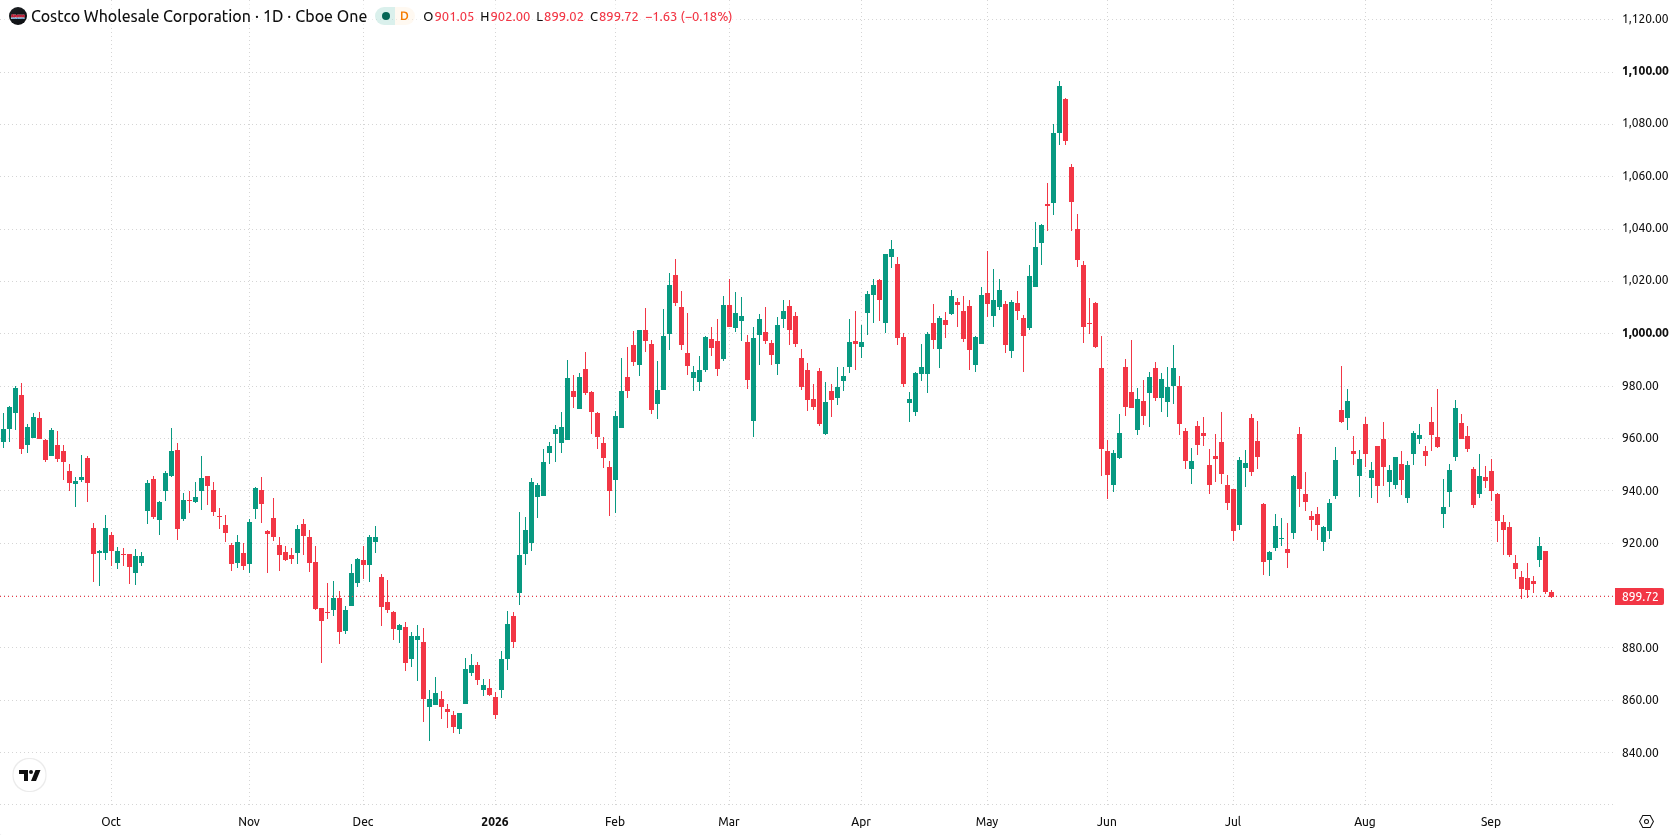
Shares of Costco Wholesale Corporation (COST) are trading near $898 as a modest decline stretches the stock into oversold territory. Technical pressure from the recent slide remains the key setup for the week ahead, keeping sellers in control and capping rebound potential into the next five sessions.
 1021.31
Highlights
- Shares of Costco fell to $898.38 over the past week and remain below key moving averages.
- Technical indicators show a bearish trend with negative momentum and oversold readings prevailing in recent sessions.
- Expected five-day range is $881.7 to $908.62 with a high probability of consolidation or further decline unless $899.08 resistance is broken.
Dividend hike and margin pressures as Costco manages cost headwinds
Costco increased its quarterly dividend by 13%, with a new $1.47 per share payment scheduled for August 7, 2024, reflecting its ongoing commitment to shareholder returns through both regular and special dividends, according to Yahoo Finance and Ticker Report. In addition, Executive Vice President Pierre Riel received 4,552 performance-based restricted share units, as disclosed in recent SEC filings. Some pressure on fourth-quarter margins is anticipated from higher fuel and transportation costs, although tariff refunds could provide partial relief in the coming period.
Oversold signals deepen as negative momentum confirms downside bias
On the daily chart, momentum remains distinctly negative, with the MACD in sell territory and the CCI reading oversold at -102.91. Bull/Bear Power is also in the oversold zone, confirming seller dominance, as the stock hugs the bottom of its weekly range amidst 2.55% volatility and a contained move within a narrow range. Immediate resistance sits at $899.08, marked by the weekly low, while the Ichimoku Kijun at $938.61 acts as further resistance overhead. With low trend strength and oversold momentum readings, short-term action favors continued consolidation and downside pressure.
Downside risk dominates with consolidation likely below resistance next week
For the next five trading days, the expected range is $881.7 to $908.62, with a very low probability of an increase and a very high probability of a decrease. The base case sees the stock stuck beneath $899.08 and consolidating within the projected range. A bullish scenario would require a decisive move above the $899.08 resistance, while a bearish break below $881.7 would open the door to further downside.
Earlier, analysts noted that Costco’s technical setup pointed to ongoing consolidation with a prevailing downside bias driven by oversold conditions. The current analysis builds on this view, highlighting fresh oversold signals and the importance of monitoring the $881.7 level for a potential further downside break in the week ahead.











-
 Afghanistan
-
 Albania
-
 Algeria
-
 Angola
-
 Argentina
-
 Armenia
-
 Australia
-
 Austria
-
 Azerbaijan
-
 Bahamas
-
 Bahrain
-
 Bangladesh
-
 Belarus
-
 Belgium
-
 Bolivia
-
 Botswana
-
 Brazil
-
 Brunei
-
 Bulgaria
-
 Cambodia
-
 Cameroon
-
 Canada
-
 Chile
-
 China
-
 Colombia
-
 Congo
-
 Costa Rica
-
 Cote d'Ivoire
-
 Croatia
-
 Cuba
-
 Cyprus
-
 Czechia
-
 DR Congo
-
 Denmark
-
 Dominican Republic
-
 Ecuador
-
 Egypt
-
 El Salvador
-
 Estonia
-
 Eswatini
-
 Ethiopia
-
 Finland
-
 France
-
 Georgia
-
 Germany
-
 Ghana
-
 Greece
-
 Haiti
-
 Hong Kong
-
 Hungary
-
 India
-
 Indonesia
-
 Iran, Islamic republic
-
 Iraq
-
 Ireland
-
 Israel
-
 Italy
-
 Jamaica
-
 Japan
-
 Jordan
-
 Kazakhstan
-
 Kenya
-
 Korea
-
 Kuwait
-
 Kyrgyzstan
-
 Laos
-
 Latvia
-
 Lebanon
-
 Lesotho
-
 Libya
-
 Lithuania
-
 Luxembourg
-
 Madagascar
-
 Malaysia
-
 Malta
-
 Mauritius
-
 Mexico
-
 Moldova
-
 Mongolia
-
 Montenegro
-
 Morocco
-
 Mozambique
-
 Myanmar
-
 Namibia
-
 Nepal
-
 Netherlands
-
 New Zealand
-
 Nigeria
-
 North Macedonia
-
 Norway
-
 Oman
-
 Pakistan
-
 Palestine
-
 Panama
-
 Papua New Guinea
-
 Paraguay
-
 Peru
-
 Philippines
-
 Poland
-
 Portugal
-
 Puerto Rico
-
 Qatar
-
 Reunion
-
 Romania
-
 Rwanda
-
 Saudi Arabia
-
 Serbia
-
 Singapore
-
 Slovakia
-
 Slovenia
-
 Somalia
-
 South Africa
-
 Spain
-
 Sri Lanka
-
 Sweden
-
 Switzerland
-
 Syria
-
 Taiwan
-
 Tajikistan
-
 Tanzania
-
 Thailand
-
 Trinidad and Tobago
-
 Tunisia
-
 Turkey
-
 UAE
-
 Uganda
-
 Ukraine
-
 United Kingdom
-
United States
-
 Uruguay
-
 Uzbekistan
-
 Venezuela
-
 Vietnam
-
 Yemen
-
 Zambia
-
 Zimbabwe
- Forex
- Crypto












