

Intuit shares drop more than 2% after Bank of America investment and new buyback plans fail to stem pressure

Intuit Inc. (INTU) fell 2.18% as sustained technical pressure weighed on the stock, even as institutional investment and new buyback plans shaped a fundamentally supportive backdrop. The decline is reinforced by INTU remaining below its 20-day, 50-day, and 200-day moving averages, which points to continued seller control across all key timeframes.
 343.92
Highlights
- Bank of America acquired more than 2.25 million shares of Intuit during the second quarter.
- Intuit approved $7.9 billion for new share buybacks and raised the quarterly dividend by 15% to $1.38 per share.
- Shares of Intuit trade below key moving averages with a forecast range of $307.38 to $336.9 and 75% probability of a downward move.
Institutional inflows and buyback expansion fail to offset persistent selling
Bank of America Corp DE acquired over 2.25 million shares of Intuit during the second quarter. Intuit's board authorized $7.9 billion for future stock repurchases in July and completed $5.5 billion in buybacks for fiscal 2026. Management also raised the quarterly dividend by 15% to $1.38 per share and issued fiscal 2027 guidance for 9–10% revenue growth and faster earnings gains, though price action has remained under broader selling pressure.
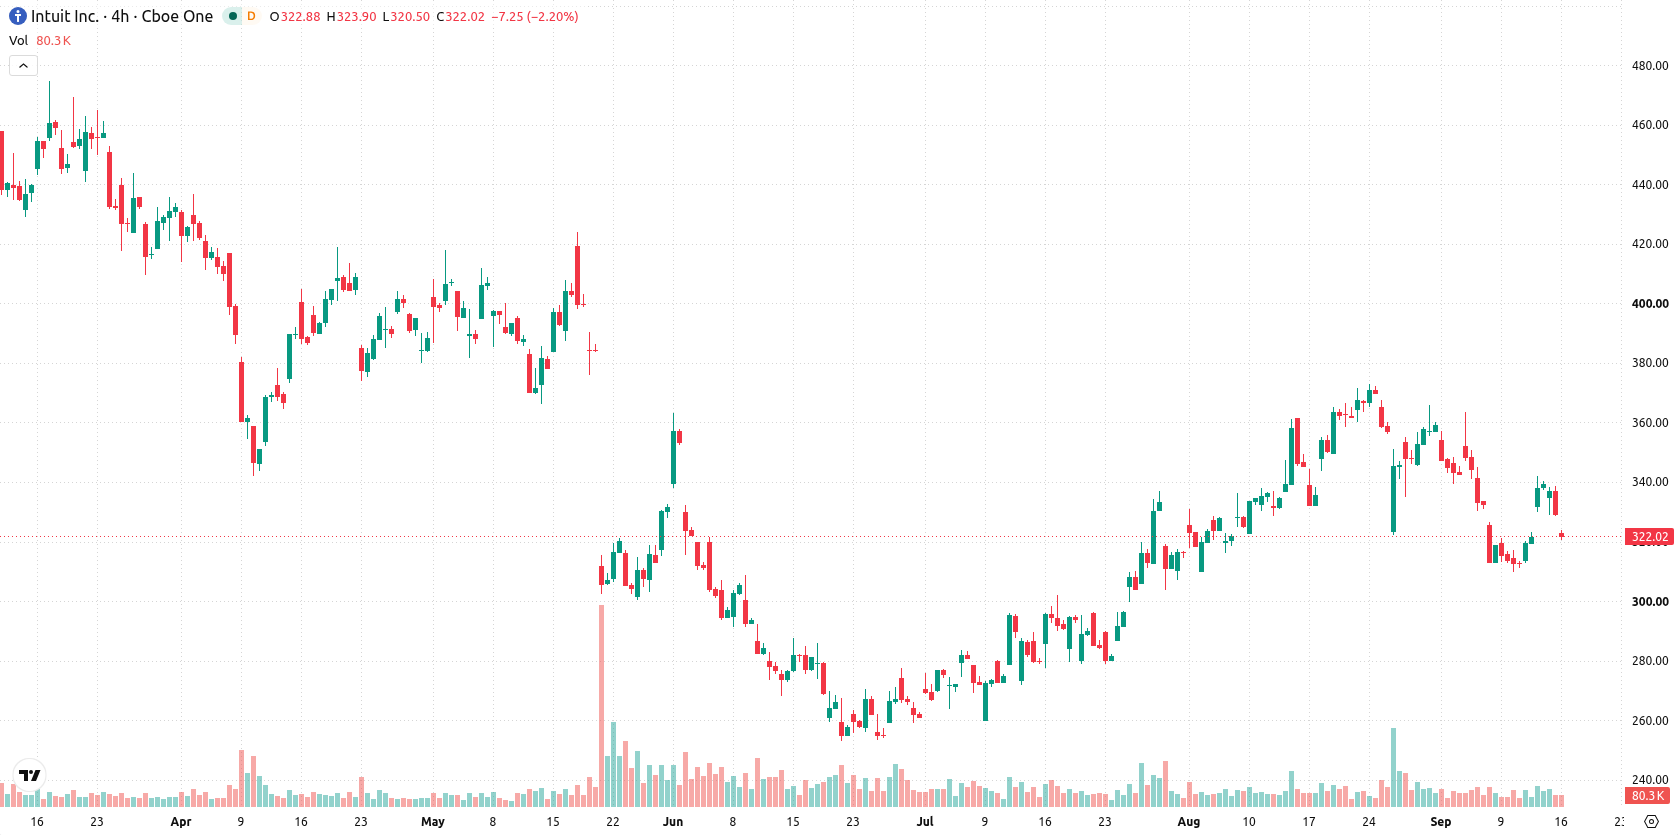
Bearish bias as price stays below resistance and momentum signals diverge
Intuit is trading below its 20-day ($343.97), 50-day ($322.17), and 200-day ($417.40) moving averages, signaling sustained pressure from sellers across short-, medium-, and long-term timeframes. Near-term resistance is now set at $322.17 and support is established at $320.94, with the Ichimoku Kijun ($341.62) confirming a bearish backdrop. Momentum readings are mixed: the MACD (-3.11) and Average Directional Index (13.51) both indicate a neutral stance. The Relative Strength Index (48.02) and Commodity Channel Index (-56.51) both signal mild selling pressure, though the Stochastic RSI (43.23) is neutral. Bull/Bear Power (5.6) shows that buyers are dominating intraday momentum, although its "Overbought" label suggests limited upside in the very short term. The stock is down $7.17, slipping 2.18% for the session, following a downside gap of about $6.78 (2.06%). Price is currently in the mid-range of today's session, with intraday volatility at 0.80%. Overall, the market shows subdued activity after the opening weakness, and there is a notable divergence between momentum and oscillator signals.
Previously it was reported that Intuit’s solid financial results and increased shareholder returns were countered by ongoing technical resistance and mixed trading signals. The latest analysis strengthens this view, emphasizing that until the stock can reclaim key moving averages or decisive momentum emerges, the primary risk remains further downside below $320.94 in the near term.










-
 Afghanistan
-
 Albania
-
 Algeria
-
 Angola
-
 Argentina
-
 Armenia
-
 Australia
-
 Austria
-
 Azerbaijan
-
 Bahamas
-
 Bahrain
-
 Bangladesh
-
 Belarus
-
 Belgium
-
 Bolivia
-
 Botswana
-
 Brazil
-
 Brunei
-
 Bulgaria
-
 Cambodia
-
 Cameroon
-
 Canada
-
 Chile
-
 China
-
 Colombia
-
 Congo
-
 Costa Rica
-
 Cote d'Ivoire
-
 Croatia
-
 Cuba
-
 Cyprus
-
 Czechia
-
 DR Congo
-
 Denmark
-
 Dominican Republic
-
 Ecuador
-
 Egypt
-
 El Salvador
-
 Estonia
-
 Eswatini
-
 Ethiopia
-
 Finland
-
 France
-
 Georgia
-
 Germany
-
 Ghana
-
 Greece
-
 Haiti
-
 Hong Kong
-
 Hungary
-
 India
-
 Indonesia
-
 Iran, Islamic republic
-
 Iraq
-
 Ireland
-
 Israel
-
 Italy
-
 Jamaica
-
 Japan
-
 Jordan
-
 Kazakhstan
-
 Kenya
-
 Korea
-
 Kuwait
-
 Kyrgyzstan
-
 Laos
-
 Latvia
-
 Lebanon
-
 Lesotho
-
 Libya
-
 Lithuania
-
 Luxembourg
-
 Madagascar
-
 Malaysia
-
 Malta
-
 Mauritius
-
 Mexico
-
 Moldova
-
 Mongolia
-
 Montenegro
-
 Morocco
-
 Mozambique
-
 Myanmar
-
 Namibia
-
 Nepal
-
 Netherlands
-
 New Zealand
-
 Nigeria
-
 North Macedonia
-
 Norway
-
 Oman
-
 Pakistan
-
 Palestine
-
 Panama
-
 Papua New Guinea
-
 Paraguay
-
 Peru
-
 Philippines
-
 Poland
-
 Portugal
-
 Puerto Rico
-
 Qatar
-
 Reunion
-
 Romania
-
 Rwanda
-
 Saudi Arabia
-
 Serbia
-
 Singapore
-
 Slovakia
-
 Slovenia
-
 Somalia
-
 South Africa
-
 Spain
-
 Sri Lanka
-
 Sweden
-
 Switzerland
-
 Syria
-
 Taiwan
-
 Tajikistan
-
 Tanzania
-
 Thailand
-
 Trinidad and Tobago
-
 Tunisia
-
 Turkey
-
 UAE
-
 Uganda
-
 Ukraine
-
 United Kingdom
-
United States
-
 Uruguay
-
 Uzbekistan
-
 Venezuela
-
 Vietnam
-
 Yemen
-
 Zambia
-
 Zimbabwe
- Forex
- Crypto












