

What's behind Synopsys's latest stock surge?

Synopsys, Inc. (SNPS) jumped 2.94% after reporting quarterly earnings that surpassed consensus estimates, driving renewed buying interest. The move looks limited, as the stock remains below all its major moving averages, signaling that broader downside momentum is still in play.
 491.23
487.41
Highlights
- Synopsys delivered quarterly earnings of $3.91 per share on $2.48 billion in revenue, both above analyst expectations.
- The company issued strong guidance for the next quarter and projected solid financial performance for full fiscal year 2026.
- Shares of Synopsys trade below key moving averages with persistent negative momentum, and the expected five-day price range is $359.11 to $397.88.
Outlook firms as Synopsys posts beats and lifts guidance
Synopsys reported quarterly earnings exceeding consensus expectations, delivering $3.91 earnings per share and $2.48 billion in revenue. The company provided robust guidance for the upcoming quarter and the full fiscal year 2026.
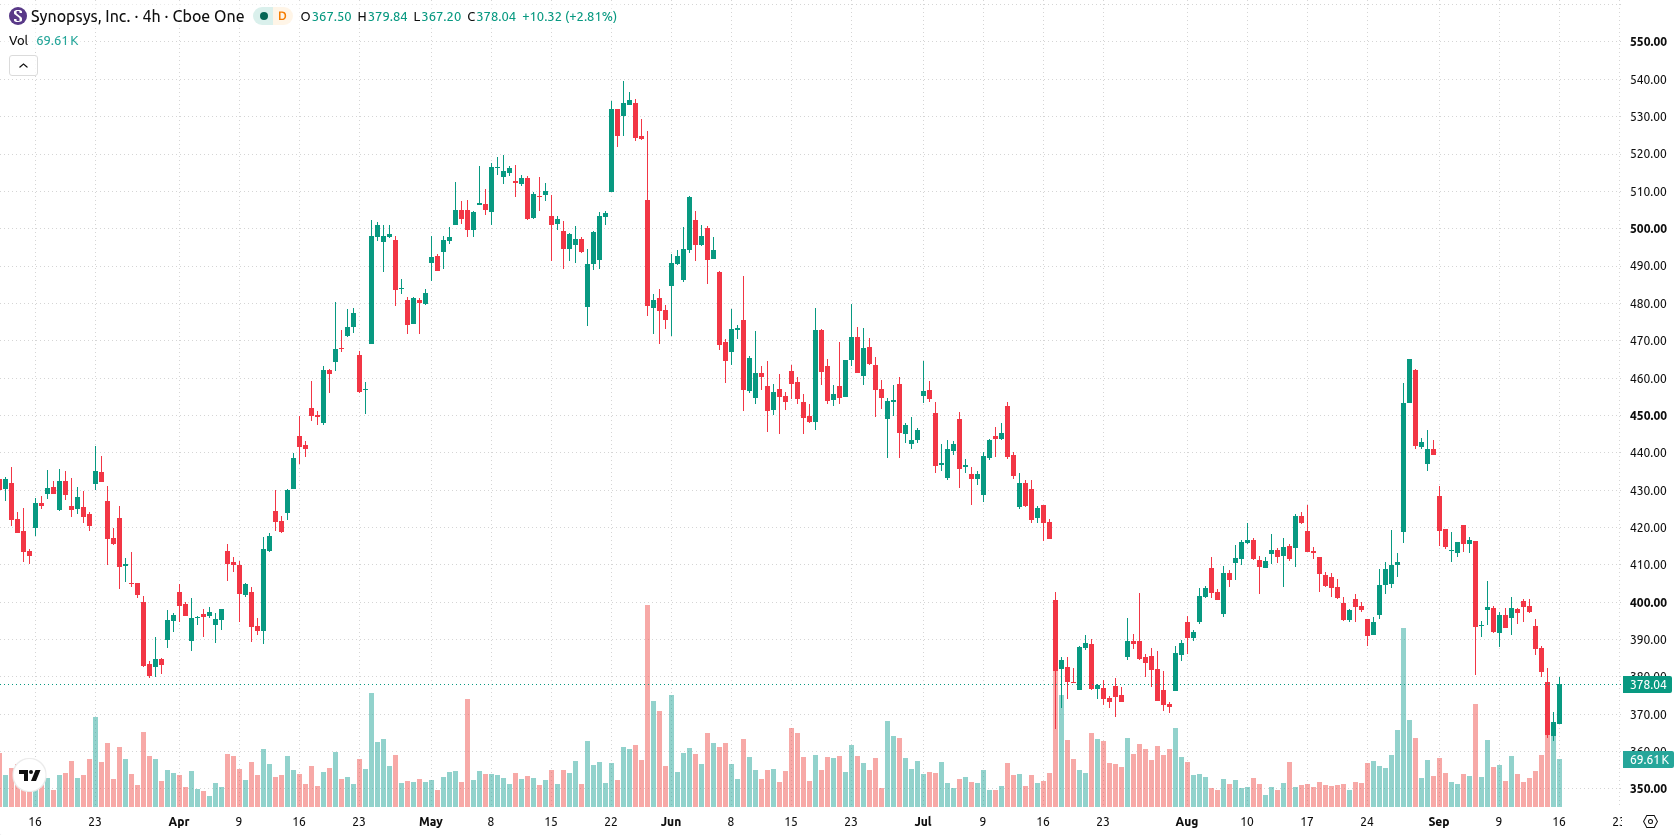
Persistent selling pressure confirmed as technicals show oversold weakness
Synopsys is trading below all its major moving averages, with the current price at $378.49 sitting under the MA-20 at $406.61, the MA-50 at $405.55, and the MA-200 at $447.09. This setup reflects persistent selling pressure across short, medium, and long-term timeframes, confirmed by the bearish alignment between the MA-50 and MA-200. The near-term ceiling stands at $397.88, and immediate support is defined by the near-term floor at $377.59. Momentum signals are negative, with the MACD indicating a sell, the ADX reading as neutral, and the RSI at 34.59 with a sell signal. Additional indicators, including Stochastic RSI, CCI, and Bull/Bear Power, all point to oversold conditions, while the Awesome Oscillator is also negative.
Earlier, analysts noted that Synopsys was exhibiting persistent technical weakness and a prevailing downside bias despite isolated buying interest. The current analysis corroborates the continued downside momentum, with the key level to watch now being a sustained break below $377.59, which could open the door to further declines toward $359.11.






Latest Synopsys News



-
 Afghanistan
-
 Albania
-
 Algeria
-
 Angola
-
 Argentina
-
 Armenia
-
 Australia
-
 Austria
-
 Azerbaijan
-
 Bahamas
-
 Bahrain
-
 Bangladesh
-
 Belarus
-
 Belgium
-
 Bolivia
-
 Botswana
-
 Brazil
-
 Brunei
-
 Bulgaria
-
 Cambodia
-
 Cameroon
-
 Canada
-
 Chile
-
 China
-
 Colombia
-
 Congo
-
 Costa Rica
-
 Cote d'Ivoire
-
 Croatia
-
 Cuba
-
 Cyprus
-
 Czechia
-
 DR Congo
-
 Denmark
-
 Dominican Republic
-
 Ecuador
-
 Egypt
-
 El Salvador
-
 Estonia
-
 Eswatini
-
 Ethiopia
-
 Finland
-
 France
-
 Georgia
-
 Germany
-
 Ghana
-
 Greece
-
 Haiti
-
 Hong Kong
-
 Hungary
-
 India
-
 Indonesia
-
 Iran, Islamic republic
-
 Iraq
-
 Ireland
-
 Israel
-
 Italy
-
 Jamaica
-
 Japan
-
 Jordan
-
 Kazakhstan
-
 Kenya
-
 Korea
-
 Kuwait
-
 Kyrgyzstan
-
 Laos
-
 Latvia
-
 Lebanon
-
 Lesotho
-
 Libya
-
 Lithuania
-
 Luxembourg
-
 Madagascar
-
 Malaysia
-
 Malta
-
 Mauritius
-
 Mexico
-
 Moldova
-
 Mongolia
-
 Montenegro
-
 Morocco
-
 Mozambique
-
 Myanmar
-
 Namibia
-
 Nepal
-
 Netherlands
-
 New Zealand
-
 Nigeria
-
 North Macedonia
-
 Norway
-
 Oman
-
 Pakistan
-
 Palestine
-
 Panama
-
 Papua New Guinea
-
 Paraguay
-
 Peru
-
 Philippines
-
 Poland
-
 Portugal
-
 Puerto Rico
-
 Qatar
-
 Reunion
-
 Romania
-
 Rwanda
-
 Saudi Arabia
-
 Serbia
-
 Singapore
-
 Slovakia
-
 Slovenia
-
 Somalia
-
 South Africa
-
 Spain
-
 Sri Lanka
-
 Sweden
-
 Switzerland
-
 Syria
-
 Taiwan
-
 Tajikistan
-
 Tanzania
-
 Thailand
-
 Trinidad and Tobago
-
 Tunisia
-
 Turkey
-
 UAE
-
 Uganda
-
 Ukraine
-
 United Kingdom
-
United States
-
 Uruguay
-
 Uzbekistan
-
 Venezuela
-
 Vietnam
-
 Yemen
-
 Zambia
-
 Zimbabwe
- Forex
- Crypto












