

AXP slides over 2% as technical weakness persists despite institutional buying

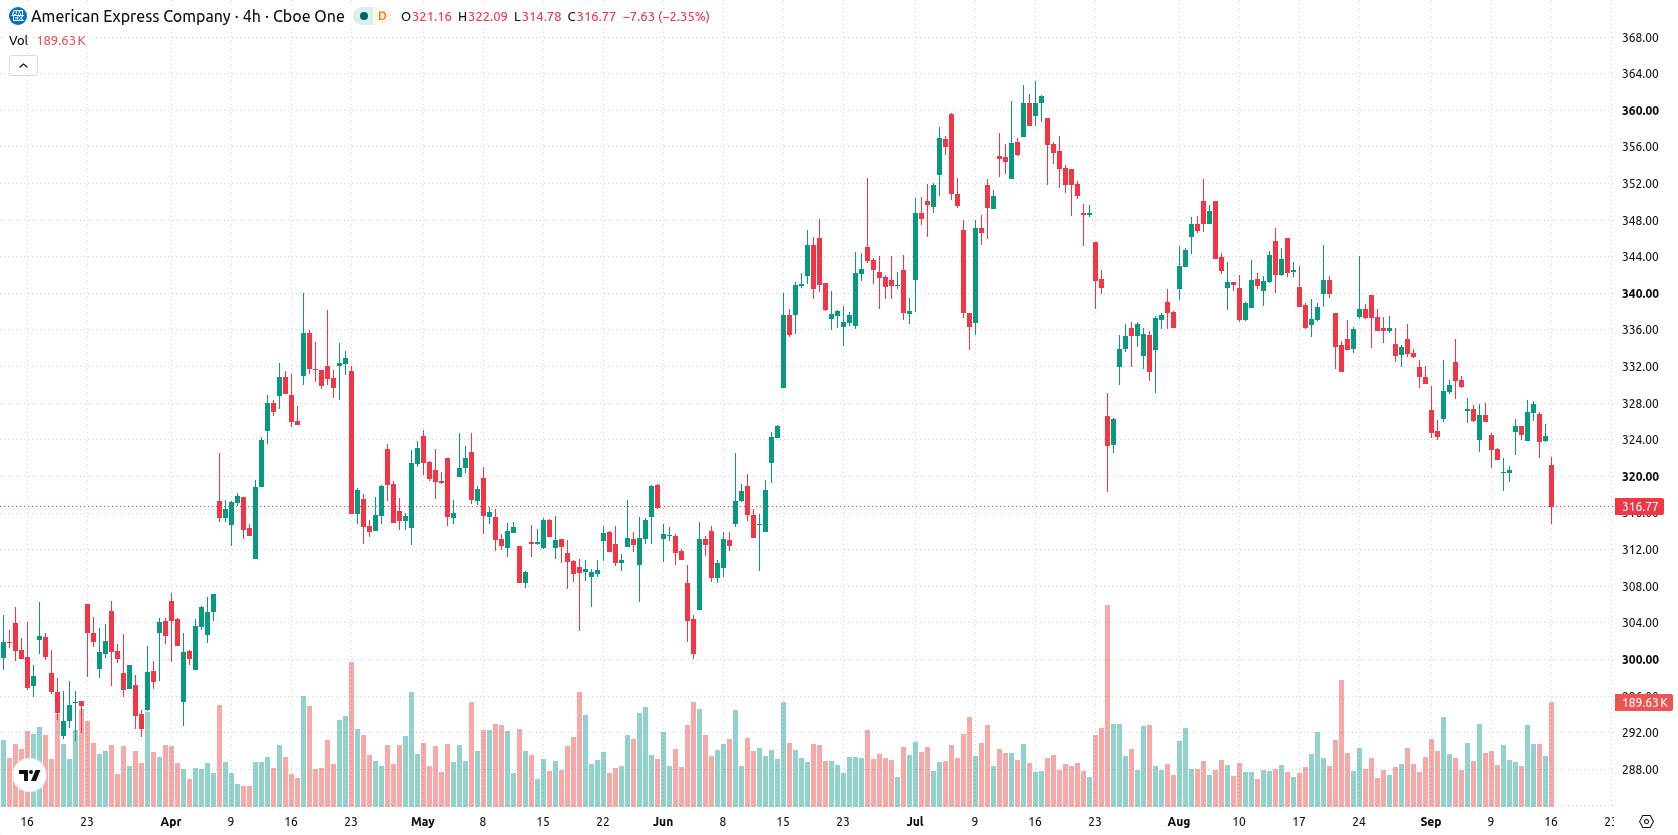
American Express Company (AXP) dropped 2.2% as ongoing selling pressure dominated the session, even as recent disclosures showed a significant increase in institutional holdings. The move is reinforced by AXP trading below its 20-day, 50-day, and 200-day moving averages, pointing to persistent downside trends across all time frames.
 319.85
319.85
319.85
Highlights
- Reynders McVeigh Capital Management increased its position in American Express by acquiring 54,429 additional shares in the second quarter.
- Berkshire Hathaway retains American Express as a core long-term holding, maintaining institutional ownership support.
- Shares of American Express trade under sustained downside pressure, with a projected range of $310.82 to $322.26 over the next five sessions and strong bearish momentum indicated by oscillators.
Long-term hold signals contrast with session's persistent seller dominance
Reynders McVeigh Capital Management LLC increased its holdings in American Express by acquiring an additional 54,429 shares in the second quarter, resulting in total ownership of 58,210 shares as disclosed to the SEC. Berkshire Hathaway is expected to continue considering American Express a core long-term holding. The session followed these developments, though price action has remained under broader selling pressure.
Bearish momentum deepens as technical barriers and volatility converge
American Express is trading below its 20-day, 50-day, and 200-day moving averages ($330.43, $338.85, and $336.34), reflecting sustained downside pressure in short-, medium-, and long-term trends. The nearest resistance sits at $318.35, with support at $310.82, while the MA-50 versus MA-200 alignment still points to a bullish long-term backdrop. Momentum indicators paint a distinctly bearish picture: the MACD and Relative Strength Index (RSI) both signal strong selling, reinforced by negative readings from the Commodity Channel Index (CCI). The CCI and RSI both indicate the stock is not oversold yet, but downside momentum is strong. The Bull/Bear Power (BBP) reading of -0.5 confirms sellers are dominating intraday momentum, with the BBP forecast flagging oversold conditions. The session opened with a downside gap of approximately $2.46 or 0.76% and the price is trading near the session low, reflecting a drop of $7.15 (2.2%) on low intraday volatility (0.26%). Recent action suggests continued downside pressure through the session with no signs of recovery from oscillators.
Earlier, analysts noted that American Express remained technically constrained by layered resistance and persistent selling pressure, despite signs of a potential inflection point. Today’s reinforced downside across all time frames—with momentum indicators flagging strong selling—suggests traders should monitor $310.82 as a critical support level for further weakness in the near term.









-
 Afghanistan
-
 Albania
-
 Algeria
-
 Angola
-
 Argentina
-
 Armenia
-
 Australia
-
 Austria
-
 Azerbaijan
-
 Bahamas
-
 Bahrain
-
 Bangladesh
-
 Belarus
-
 Belgium
-
 Bolivia
-
 Botswana
-
 Brazil
-
 Brunei
-
 Bulgaria
-
 Cambodia
-
 Cameroon
-
 Canada
-
 Chile
Chile
-
 China
China
-
 Colombia
-
 Congo
Congo
-
 Costa Rica
-
 Cote d'Ivoire
-
 Croatia
-
 Cuba
Cuba
-
 Cyprus
-
 Czechia
-
 DR Congo
-
 Denmark
-
 Dominican Republic
-
 Ecuador
-
 Egypt
Egypt
-
 El Salvador
-
 Estonia
-
 Eswatini
-
 Ethiopia
-
 Finland
-
 France
-
 Georgia
-
 Germany
-
 Ghana
Ghana
-
 Greece
-
 Haiti
Haiti
-
 Hong Kong
-
 Hungary
-
 India
India
-
 Indonesia
-
 Iran, Islamic republic
-
 Iraq
Iraq
-
 Ireland
-
 Israel
-
 Italy
Italy
-
 Jamaica
-
 Japan
Japan
-
 Jordan
-
 Kazakhstan
-
 Kenya
Kenya
-
 Korea
Korea
-
 Kuwait
-
 Kyrgyzstan
-
 Laos
Laos
-
 Latvia
-
 Lebanon
-
 Lesotho
-
 Libya
Libya
-
 Lithuania
-
 Luxembourg
-
 Madagascar
-
 Malaysia
-
 Malta
Malta
-
 Mauritius
-
 Mexico
-
 Moldova
-
 Mongolia
-
 Montenegro
-
 Morocco
-
 Mozambique
-
 Myanmar
-
 Namibia
-
 Nepal
Nepal
-
 Netherlands
-
 New Zealand
-
 Nigeria
-
 North Macedonia
-
 Norway
-
 Oman
Oman
-
 Pakistan
-
 Palestine
-
 Panama
-
 Papua New Guinea
-
 Paraguay
-
 Peru
Peru
-
 Philippines
-
 Poland
-
 Portugal
-
 Puerto Rico
-
 Qatar
Qatar
-
 Reunion
-
 Romania
-
 Rwanda
-
 Saudi Arabia
-
 Serbia
-
 Singapore
-
 Slovakia
-
 Slovenia
-
 Somalia
-
 South Africa
-
 Spain
Spain
-
 Sri Lanka
-
 Sweden
-
 Switzerland
-
 Syria
Syria
-
 Taiwan
-
 Tajikistan
-
 Tanzania
-
 Thailand
-
 Trinidad and Tobago
-
 Tunisia
-
 Turkey
-
 UAE
UAE
-
 Uganda
-
 Ukraine
-
 United Kingdom
-
United States
-
 Uruguay
-
 Uzbekistan
-
 Venezuela
-
 Vietnam
-
 Yemen
Yemen
-
 Zambia
-
 Zimbabwe
- Forex
- Crypto












