

Wells Fargo shares trade choppy amid sharply diverging technical signals: weekly analysis

Shares of Wells Fargo & Company (WFC) are trading near $86.50 after slipping around 4% this week, as sellers pressed the stock deep into oversold territory. Technical signals remain mixed, with sharply diverging momentum drivers now dictating a choppy setup. The coming week will test whether support can withstand pressure as conflicting cues persist.
 86.03
86.03
Highlights
- Shares of Wells Fargo fell 4.1% over the past week to $86.51, closing near recent lows below key moving averages.
- Short-term trend is bearish with shares forecast to consolidate between support at $86.12 and resistance at $87.18.
- Volatility reached 6.61% and technical signals diverge, with a 59% probability of further declines and a trading range of $81.39 to $89.05 expected in the coming week.
Loan growth outlook and institutional inflows as volatility weighs on sentiment
Wells Fargo raised its full-year loan growth outlook despite ongoing deposit funding cost pressures, according to TradingKey. Additionally, Virginia Retirement Systems ET Al made a new investment of approximately $1.12 million in WFC as reported by MarketBeat. These developments may add an undercurrent of institutional interest amid current volatility.
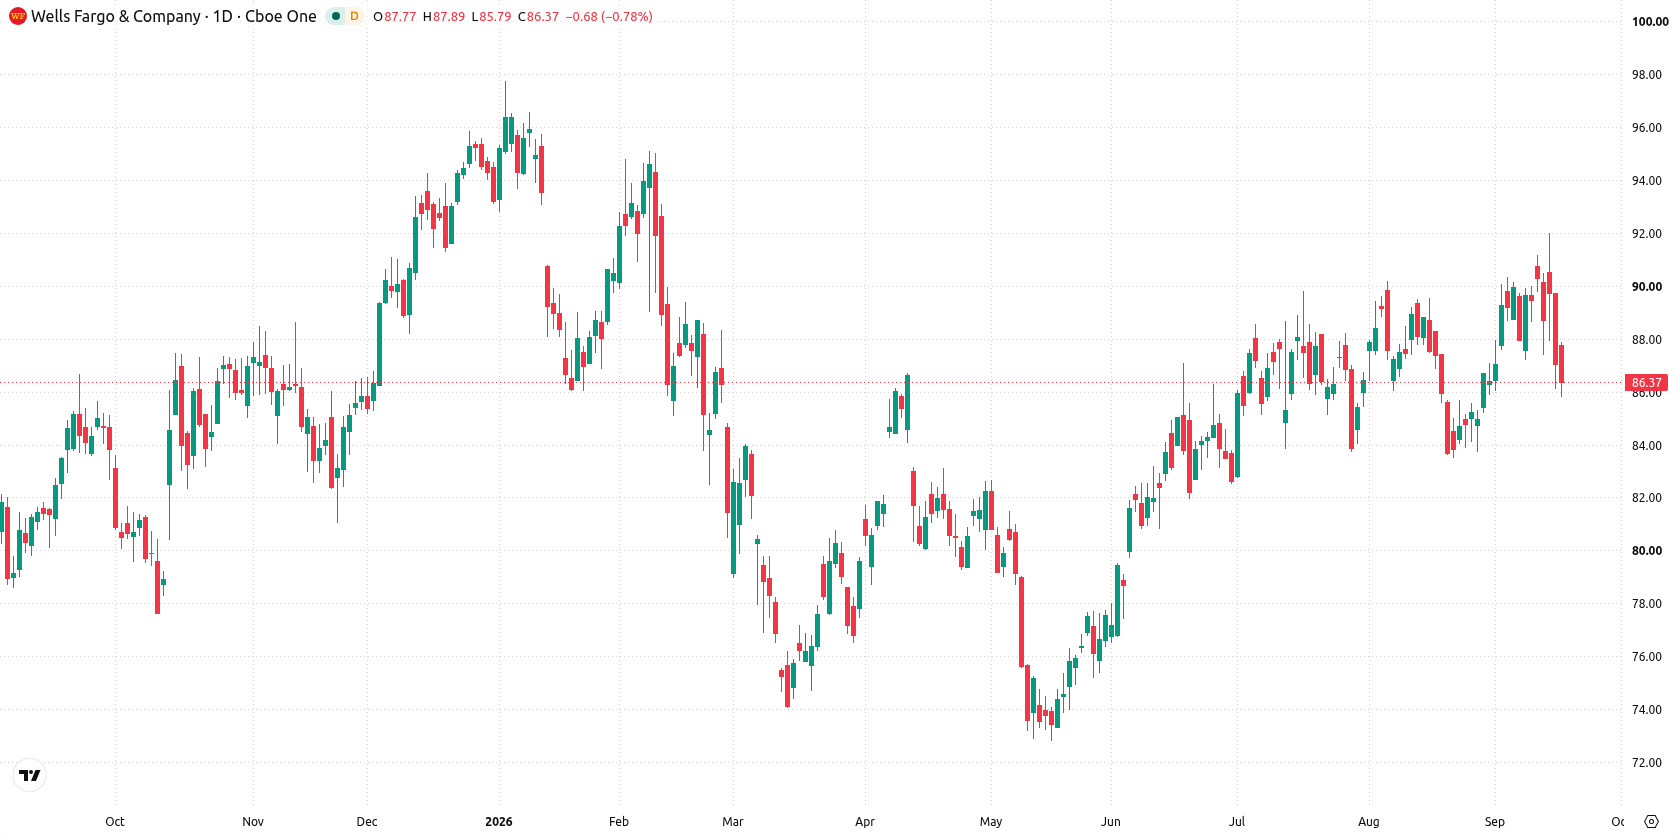
Bearish daily structure as oversold RSI and mixed momentum signals drive rangebound risk
On the daily chart, the structure has tilted bearish with the stock pinned to nearest support at $86.12 and momentum flagged by a Stochastic RSI in oversold territory at 15.16. This comes amid a contained move within a narrow range, as volatility reached 6.61% in the past week and MACD shows a strong buy bias, signaling a possible clash between bearish price structure and underlying momentum. The nearest resistance stands at $87.18 from the 50-day moving average, with the Ichimoku Kijun at $87.75 acting as a further cap. Diverging momentum signals highlight the risk of choppy, rangebound trading over the next several days.
Downside bias prevails as consolidation expected between key support and resistance next week
Over the coming trading week, shares of Wells Fargo are forecast to range between $81.39 and $89.05. There is a 41% probability of an increase and a 59% probability of a decrease, with provider signals tilted to the downside. The base case calls for consolidation between support at $86.12 and resistance at $87.18. A sustained push above resistance could open the way toward the upper end of the expected range near $89.05, while a drop below $86.12 sets up a possible slide toward $81.39.
Earlier, analysts noted that Wells Fargo’s technical setup was supported by strong institutional demand and firming momentum indicators, even as near-term headwinds persisted. The latest developments—highlighting renewed institutional flows alongside sustained volatility—add a new dimension, with traders advised to watch for any decisive move beyond the $86.12–$87.18 consolidation band to signal the next directional trend.









-
 Afghanistan
-
 Albania
-
 Algeria
-
 Angola
-
 Argentina
-
 Armenia
-
 Australia
-
 Austria
-
 Azerbaijan
-
 Bahamas
-
 Bahrain
-
 Bangladesh
-
 Belarus
-
 Belgium
-
 Bolivia
-
 Botswana
-
 Brazil
-
 Brunei
-
 Bulgaria
-
 Cambodia
-
 Cameroon
-
 Canada
-
 Chile
-
 China
-
 Colombia
-
 Congo
-
 Costa Rica
-
 Cote d'Ivoire
-
 Croatia
-
 Cuba
-
 Cyprus
-
 Czechia
-
 DR Congo
-
 Denmark
-
 Dominican Republic
-
 Ecuador
-
 Egypt
-
 El Salvador
-
 Estonia
-
 Eswatini
-
 Ethiopia
-
 Finland
-
 France
-
 Georgia
-
 Germany
-
 Ghana
-
 Greece
-
 Haiti
-
 Hong Kong
-
 Hungary
-
 India
-
 Indonesia
-
 Iran, Islamic republic
-
 Iraq
-
 Ireland
-
 Israel
-
 Italy
-
 Jamaica
-
 Japan
-
 Jordan
-
 Kazakhstan
-
 Kenya
-
 Korea
-
 Kuwait
-
 Kyrgyzstan
-
 Laos
-
 Latvia
-
 Lebanon
-
 Lesotho
-
 Libya
-
 Lithuania
-
 Luxembourg
-
 Madagascar
-
 Malaysia
-
 Malta
-
 Mauritius
-
 Mexico
-
 Moldova
-
 Mongolia
-
 Montenegro
-
 Morocco
-
 Mozambique
-
 Myanmar
-
 Namibia
-
 Nepal
-
 Netherlands
-
 New Zealand
-
 Nigeria
-
 North Macedonia
-
 Norway
-
 Oman
-
 Pakistan
-
 Palestine
-
 Panama
-
 Papua New Guinea
-
 Paraguay
-
 Peru
-
 Philippines
-
 Poland
-
 Portugal
-
 Puerto Rico
-
 Qatar
-
 Reunion
-
 Romania
-
 Rwanda
-
 Saudi Arabia
-
 Serbia
-
 Singapore
-
 Slovakia
-
 Slovenia
-
 Somalia
-
 South Africa
-
 Spain
-
 Sri Lanka
-
 Sweden
-
 Switzerland
-
 Syria
-
 Taiwan
-
 Tajikistan
-
 Tanzania
-
 Thailand
-
 Trinidad and Tobago
-
 Tunisia
-
 Turkey
-
 UAE
-
 Uganda
-
 Ukraine
-
 United Kingdom
-
United States
-
 Uruguay
-
 Uzbekistan
-
 Venezuela
-
 Vietnam
-
 Yemen
-
 Zambia
-
 Zimbabwe
- Forex
- Crypto












