

What's behind Abbott's latest 1.6% stock pullback?

Abbott Laboratories (ABT) fell 1.57% as technical selling pressure accelerated, with bearish momentum and negative signals from multiple indicators driving price action. The intensity of the move is supported by Abbott holding firmly below its 20-, 50-, and 200-day moving averages, confirming strong downside pressure.
 104.87
105.85
Highlights
- Shares of Abbott trade below key moving averages, confirming strong downward pressure across short, medium, and long-term trends.
- Technical indicators including MACD, ADX, RSI, Stochastic RSI, and CCI all predict a continued downside and oversold conditions.
- Abbott stock is expected to trade in a $99.31 to $102.75 range over the next five sessions, with a 71% probability of further decline.
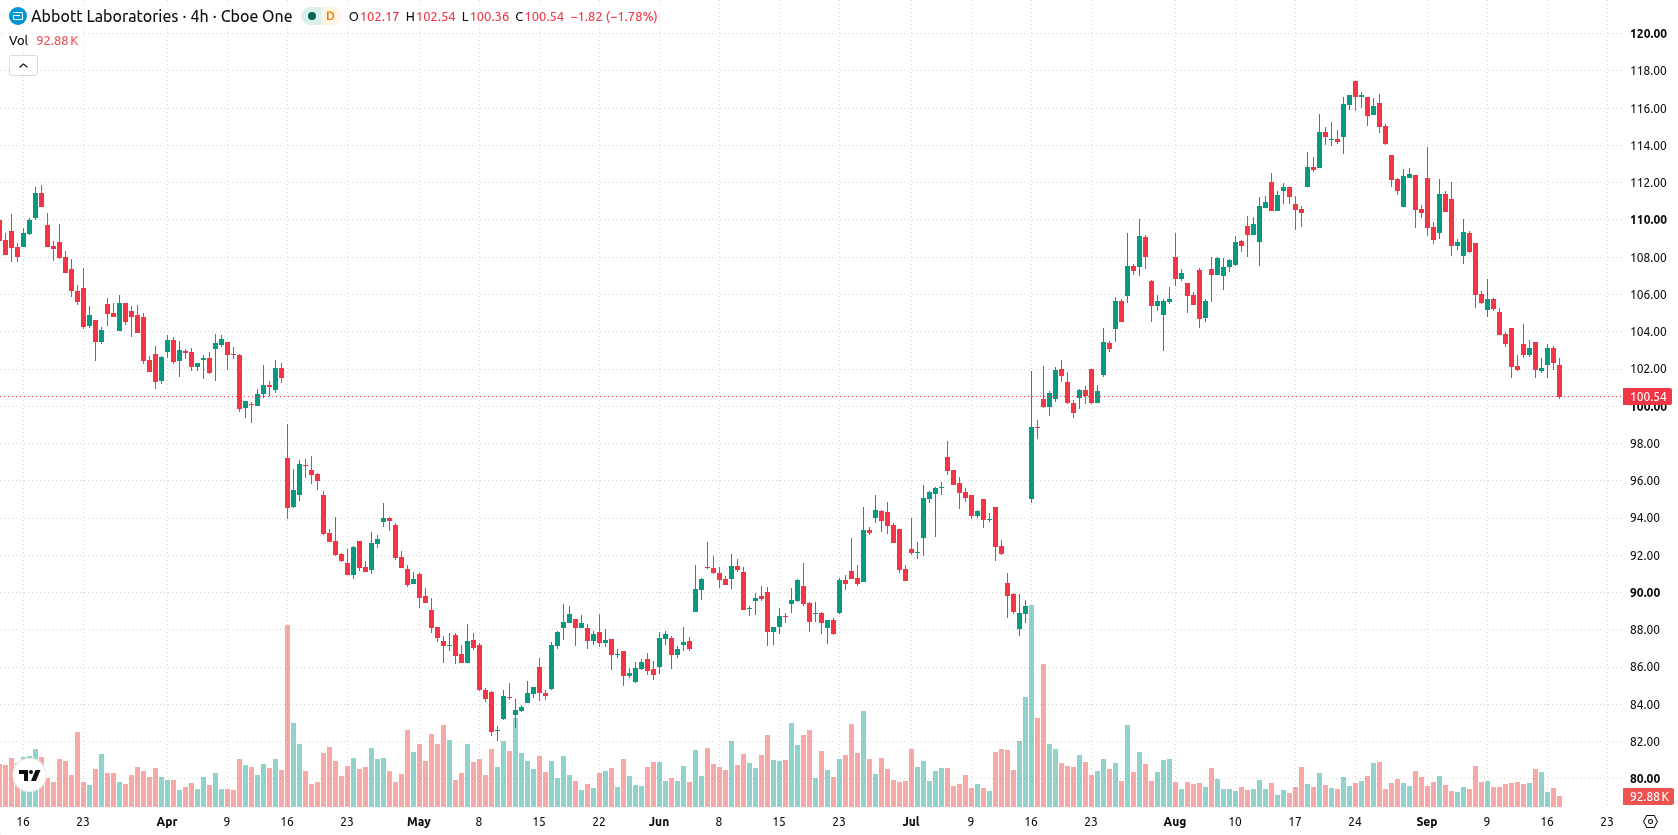
Persistent weakness as key averages breached and momentum turns negative
Abbott trades well below its key daily moving averages, with the current price of $100.75 holding under the 20-day ($109.33), 50-day ($105.71), and 200-day ($105.46) levels. This structure reflects persistent downward pressure across short-, medium-, and long-term trends, and the Ichimoku Kijun at $109.38 now represents distant resistance. Closest price resistance for Abbott is at $101.47, with the nearest support at $99.31. Technical momentum indicators point to sustained downside. Both MACD and ADX signal 'Sell', while the RSI is at 36.14, approaching oversold territory. Stochastic RSI and CCI also display oversold conditions. Bull/Bear Power (BBP) is negative at -2.37 and reveals sellers in control of intraday activity. The Awesome Oscillator forecasts ongoing decline. The stock opened with a minor downside gap and has continued to trade toward session lows, while intraday volatility was measured at 0.23%.
Earlier, analysts noted that Abbott Laboratories faced persistent selling pressure with technical signals pointing to continued short- and long-term weakness despite some stabilization efforts. The current technical breakdown reinforces this bearish outlook, with traders advised to monitor the $99.31 support as a potential tipping point for accelerated downside risk.








-
 Afghanistan
-
 Albania
-
 Algeria
-
 Angola
-
 Argentina
-
 Armenia
-
 Australia
-
 Austria
-
 Azerbaijan
-
 Bahamas
-
 Bahrain
-
 Bangladesh
-
 Belarus
-
 Belgium
-
 Bolivia
-
 Botswana
-
 Brazil
-
 Brunei
-
 Bulgaria
-
 Cambodia
-
 Cameroon
-
 Canada
-
 Chile
-
 China
-
 Colombia
-
 Congo
-
 Costa Rica
-
 Cote d'Ivoire
-
 Croatia
-
 Cuba
-
 Cyprus
-
 Czechia
-
 DR Congo
-
 Denmark
-
 Dominican Republic
-
 Ecuador
-
 Egypt
-
 El Salvador
-
 Estonia
-
 Eswatini
-
 Ethiopia
-
 Finland
-
 France
-
 Georgia
-
 Germany
-
 Ghana
-
 Greece
-
 Haiti
-
 Hong Kong
-
 Hungary
-
 India
-
 Indonesia
-
 Iran, Islamic republic
-
 Iraq
-
 Ireland
-
 Israel
-
 Italy
-
 Jamaica
-
 Japan
-
 Jordan
-
 Kazakhstan
-
 Kenya
-
 Korea
-
 Kuwait
-
 Kyrgyzstan
-
 Laos
-
 Latvia
-
 Lebanon
-
 Lesotho
-
 Libya
-
 Lithuania
-
 Luxembourg
-
 Madagascar
-
 Malaysia
-
 Malta
-
 Mauritius
-
 Mexico
-
 Moldova
-
 Mongolia
-
 Montenegro
-
 Morocco
-
 Mozambique
-
 Myanmar
-
 Namibia
-
 Nepal
-
 Netherlands
-
 New Zealand
-
 Nigeria
-
 North Macedonia
-
 Norway
-
 Oman
-
 Pakistan
-
 Palestine
-
 Panama
-
 Papua New Guinea
-
 Paraguay
-
 Peru
-
 Philippines
-
 Poland
-
 Portugal
-
 Puerto Rico
-
 Qatar
-
 Reunion
-
 Romania
-
 Rwanda
-
 Saudi Arabia
-
 Serbia
-
 Singapore
-
 Slovakia
-
 Slovenia
-
 Somalia
-
 South Africa
-
 Spain
-
 Sri Lanka
-
 Sweden
-
 Switzerland
-
 Syria
-
 Taiwan
-
 Tajikistan
-
 Tanzania
-
 Thailand
-
 Trinidad and Tobago
-
 Tunisia
-
 Turkey
-
 UAE
-
 Uganda
-
 Ukraine
-
 United Kingdom
-
United States
-
 Uruguay
-
 Uzbekistan
-
 Venezuela
-
 Vietnam
-
 Yemen
-
 Zambia
-
 Zimbabwe
- Forex
- Crypto












