

Nano Dimension stock holds near $1.56 resistance: Technical outlook

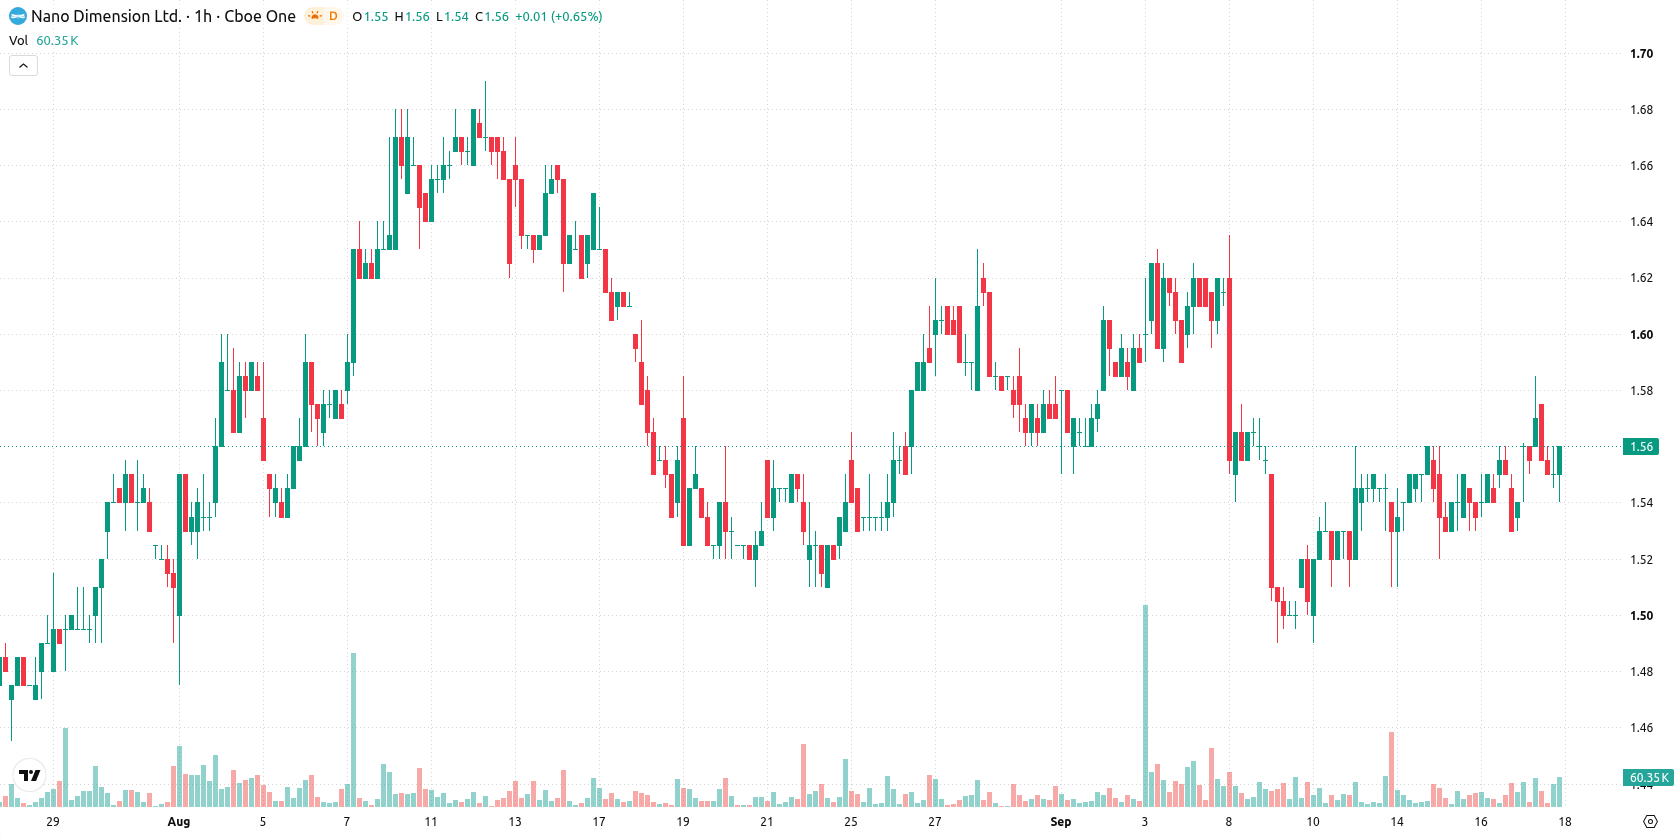
Nano Dimension (NNDM) stock is trading at $1.55 after a modest gain, marking a slight up move for the day. The price sits above its key moving averages in the short- and medium-term view, reflecting underlying upward interest.
 1.28
1.38
Highlights
- Price trades above short- and medium-term moving averages but remains below the long-term average, confirming persistent bearish pressure.
- Multiple intraday momentum indicators issue buy signals, but neutral readings and modest daily gains indicate an incomplete confirmation of upward momentum.
- The price is expected to trade between $1.52 to $1.59 over the next 2 to 3 days, with 53% probability favoring an upward move.
Conflicting momentum signals as resistance and volatility challenge bulls
On the hourly chart, price is above the MA-20 at $1.55 and MA-50 at $1.54, while remaining below the daily MA-200 at $1.67. The Ichimoku Kijun at $1.56 is the nearest resistance. Intraday indicators show Buy signals from MACD, ADX, and Bull/Bear Power, indicating bullish momentum, while Stoch RSI and CCI are Neutral. RSI registers a modestly positive level at 51.02 with a Buy reading, and the Awesome Oscillator remains neutral, revealing slight divergence between momentum signals and oscillators. Despite an intraday gap up and moderate volatility, price is near today's low, meaning the upward indicator signals are not yet fully confirmed by price action.
Sideways consolidation likely as breakout and downside risks develop
For the next 2–3 trading days, NNDM is expected to stay within a typical volatility band between $1.52 and $1.59. Probability analysis assigns a 53% chance of an upward move, but the baseline scenario is for sideways consolidation within this range. A decisive break above the $1.56 resistance would open room for further gains, while a drop below $1.52 may lead to downside acceleration.
Earlier, analysts noted that Nano Dimension was trading with mixed technical signals and a prevailing expectation of sideways movement. The latest analysis introduces a slight bullish bias in the short term, and traders should monitor the $1.56 resistance level as an immediate indicator for further direction.






Latest Nano Dimension News




-
 Afghanistan
-
 Albania
-
 Algeria
-
 Angola
-
 Argentina
-
 Armenia
-
 Australia
-
 Austria
-
 Azerbaijan
-
 Bahamas
-
 Bahrain
-
 Bangladesh
-
 Belarus
-
 Belgium
-
 Bolivia
-
 Botswana
-
 Brazil
-
 Brunei
-
 Bulgaria
-
 Cambodia
-
 Cameroon
-
 Canada
-
 Chile
-
 China
-
 Colombia
-
 Congo
-
 Costa Rica
-
 Cote d'Ivoire
-
 Croatia
-
 Cuba
-
 Cyprus
-
 Czechia
-
 DR Congo
-
 Denmark
-
 Dominican Republic
-
 Ecuador
-
 Egypt
-
 El Salvador
-
 Estonia
-
 Eswatini
-
 Ethiopia
-
 Finland
-
 France
-
 Georgia
-
 Germany
-
 Ghana
-
 Greece
-
 Haiti
-
 Hong Kong
-
 Hungary
-
 India
-
 Indonesia
-
 Iran, Islamic republic
-
 Iraq
-
 Ireland
-
 Israel
-
 Italy
-
 Jamaica
-
 Japan
-
 Jordan
-
 Kazakhstan
-
 Kenya
-
 Korea
-
 Kuwait
-
 Kyrgyzstan
-
 Laos
-
 Latvia
-
 Lebanon
-
 Lesotho
-
 Libya
-
 Lithuania
-
 Luxembourg
-
 Madagascar
-
 Malaysia
-
 Malta
-
 Mauritius
-
 Mexico
-
 Moldova
-
 Mongolia
-
 Montenegro
-
 Morocco
-
 Mozambique
-
 Myanmar
-
 Namibia
-
 Nepal
-
 Netherlands
-
 New Zealand
-
 Nigeria
-
 North Macedonia
-
 Norway
-
 Oman
-
 Pakistan
-
 Palestine
-
 Panama
-
 Papua New Guinea
-
 Paraguay
-
 Peru
-
 Philippines
-
 Poland
-
 Portugal
-
 Puerto Rico
-
 Qatar
-
 Reunion
-
 Romania
-
 Rwanda
-
 Saudi Arabia
-
 Serbia
-
 Singapore
-
 Slovakia
-
 Slovenia
-
 Somalia
-
 South Africa
-
 Spain
-
 Sri Lanka
-
 Sweden
-
 Switzerland
-
 Syria
-
 Taiwan
-
 Tajikistan
-
 Tanzania
-
 Thailand
-
 Trinidad and Tobago
-
 Tunisia
-
 Turkey
-
 UAE
-
 Uganda
-
 Ukraine
-
 United Kingdom
-
United States
-
 Uruguay
-
 Uzbekistan
-
 Venezuela
-
 Vietnam
-
 Yemen
-
 Zambia
-
 Zimbabwe
- Forex
- Crypto












