

Intuit stock tests $289.40 support: Downside targets to watch

Intuit Inc. (INTU) stock is trading at $301.71, down 3.67% on the day and lingering below its key moving averages. The price remains under pressure in a low volatility session as sellers continue to dominate short-, medium-, and long-term trends.
 340.99
343.57
Highlights
- Intuit reaffirms 2027 earnings guidance with GAAP diluted EPS projected at $20.12 to $20.36 and operating income between $7.41 billion and $7.49 billion.
- The company maintains its revenue targets and expands its AI-driven Intuit Intelligence with a focus on assisted-tax and mid-market business lines.
- Shares of Intuit trade below key moving averages with bearish momentum dominating and 78% probability for a $289.4 to $314.02 range over the next 2 to 3 sessions.
Investor expectations steady as 2027 targets reiterated despite weak catalysts
Intuit reiterated its financial guidance for fiscal 2027 during its Investor Day event at its Mountain View headquarters, projecting GAAP diluted earnings per share of $20.12 to $20.36, non-GAAP diluted earnings per share of $22.88 to $23.12, and GAAP operating income between $7.41 billion and $7.49 billion. This confirmation of standing financial targets serves to steady investor expectations, yet introduces no fresh catalysts in the wake of recent customer growth shortfalls. The company also reaffirmed its fiscal first quarter and full-year 2027 revenue targets and is expanding its AI-driven 'Intuit Intelligence' platform with a greater focus on assisted-tax and mid-market business segments, according to MarketBeat.
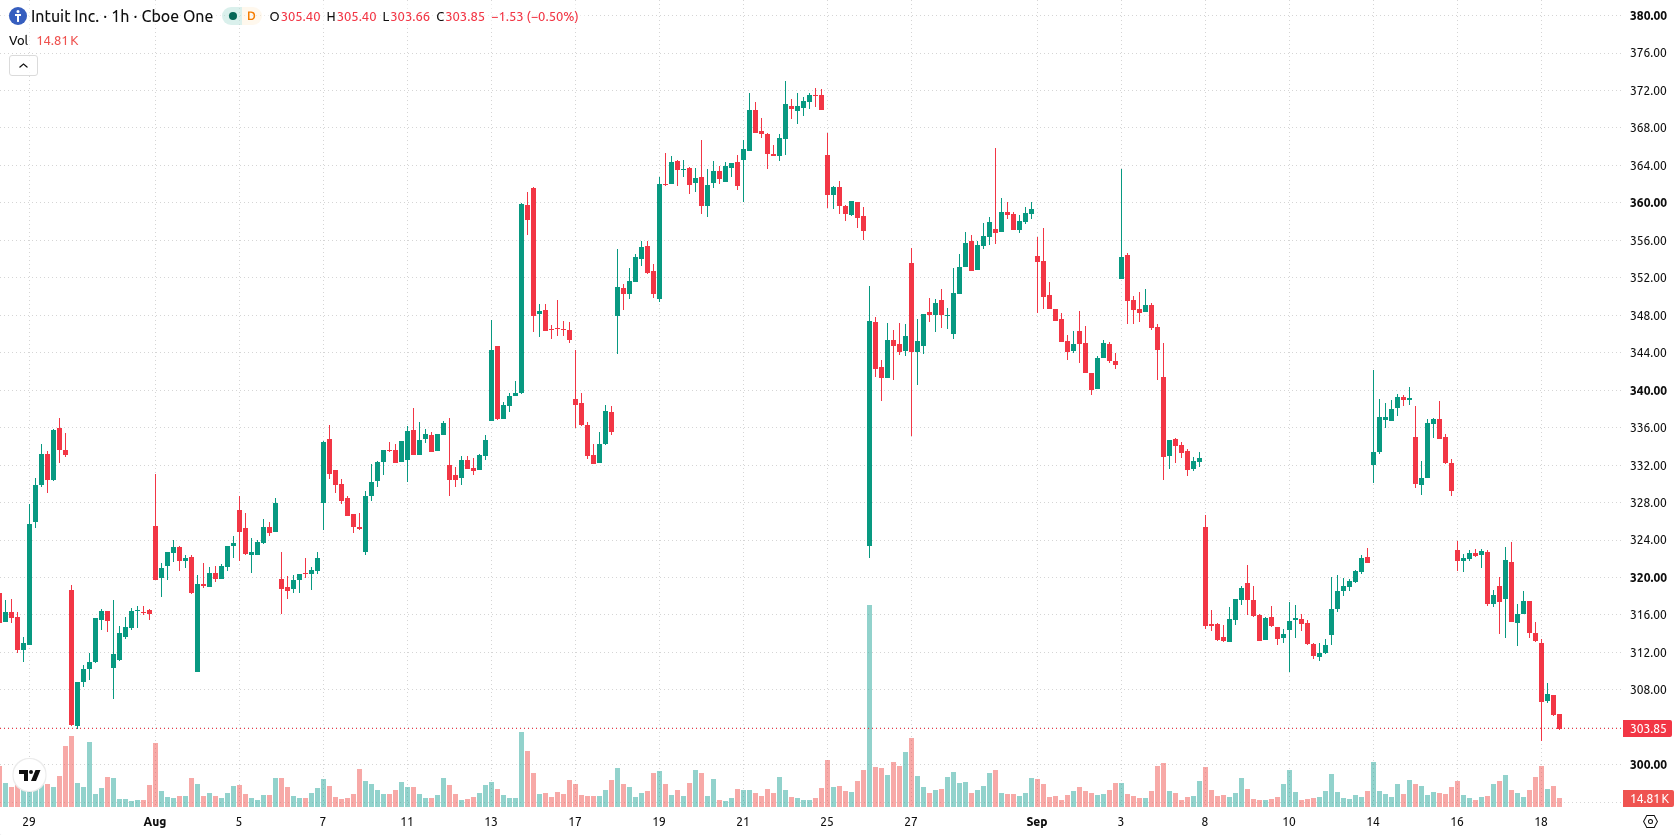
Bearish momentum persists as support untested and rebound signals diverge
INTU is trading below the MA-20 ($321.43), MA-50 ($322.18), and well under the MA-200 ($414.24) on the hourly chart. The nearest resistance is at the Ichimoku Kijun level of $326.41, while short-term support is untested toward the recent session low. Technical indicators remain firmly on the bearish side, with MACD and ADX both in sell territory. RSI is at 36.9, indicating the asset is approaching oversold conditions, and both CCI and Bull/Bear Power confirm ongoing seller dominance. Despite this, Stochastic RSI signals a strong buy and points to a possibility of a short-term rebound, although this diverges from the more negative readings seen in the Awesome Oscillator and other momentum signals.
Downside risk heightened as range-trading consolidation remains likely
In the near term, INTU is expected to trade within a band of $289.4 to $314.02 over the next two to three sessions, with a 78% probability assigned to continued downside pressure. A consolidation scenario within this range is assumed as the baseline. Should the price break above $326.41, this could trigger a sharper rebound; conversely, a breakdown below $289.4 would likely confirm renewed selling momentum.
Previously it was reported that Intuit remained under sustained technical pressure despite supportive fundamentals and increased shareholder returns. This latest analysis reinforces the bearish outlook, highlighting a narrow trading band with downside bias and advising close monitoring of the $289.4 support level in the coming sessions.










-
 Afghanistan
-
 Albania
-
 Algeria
-
 Angola
-
 Argentina
-
 Armenia
-
 Australia
-
 Austria
-
 Azerbaijan
-
 Bahamas
-
 Bahrain
-
 Bangladesh
-
 Belarus
-
 Belgium
-
 Bolivia
-
 Botswana
-
 Brazil
-
 Brunei
-
 Bulgaria
-
 Cambodia
-
 Cameroon
-
 Canada
-
 Chile
-
 China
-
 Colombia
-
 Congo
-
 Costa Rica
-
 Cote d'Ivoire
-
 Croatia
-
 Cuba
-
 Cyprus
-
 Czechia
-
 DR Congo
-
 Denmark
-
 Dominican Republic
-
 Ecuador
-
 Egypt
-
 El Salvador
-
 Estonia
-
 Eswatini
-
 Ethiopia
-
 Finland
-
 France
-
 Georgia
-
 Germany
-
 Ghana
-
 Greece
-
 Haiti
-
 Hong Kong
-
 Hungary
-
 India
-
 Indonesia
-
 Iran, Islamic republic
-
 Iraq
-
 Ireland
-
 Israel
-
 Italy
-
 Jamaica
-
 Japan
-
 Jordan
-
 Kazakhstan
-
 Kenya
-
 Korea
-
 Kuwait
-
 Kyrgyzstan
-
 Laos
-
 Latvia
-
 Lebanon
-
 Lesotho
-
 Libya
-
 Lithuania
-
 Luxembourg
-
 Madagascar
-
 Malaysia
-
 Malta
-
 Mauritius
-
 Mexico
-
 Moldova
-
 Mongolia
-
 Montenegro
-
 Morocco
-
 Mozambique
-
 Myanmar
-
 Namibia
-
 Nepal
-
 Netherlands
-
 New Zealand
-
 Nigeria
-
 North Macedonia
-
 Norway
-
 Oman
-
 Pakistan
-
 Palestine
-
 Panama
-
 Papua New Guinea
-
 Paraguay
-
 Peru
-
 Philippines
-
 Poland
-
 Portugal
-
 Puerto Rico
-
 Qatar
-
 Reunion
-
 Romania
-
 Rwanda
-
 Saudi Arabia
-
 Serbia
-
 Singapore
-
 Slovakia
-
 Slovenia
-
 Somalia
-
 South Africa
-
 Spain
-
 Sri Lanka
-
 Sweden
-
 Switzerland
-
 Syria
-
 Taiwan
-
 Tajikistan
-
 Tanzania
-
 Thailand
-
 Trinidad and Tobago
-
 Tunisia
-
 Turkey
-
 UAE
-
 Uganda
-
 Ukraine
-
 United Kingdom
-
United States
-
 Uruguay
-
 Uzbekistan
-
 Venezuela
-
 Vietnam
-
 Yemen
-
 Zambia
-
 Zimbabwe
- Forex
- Crypto












