


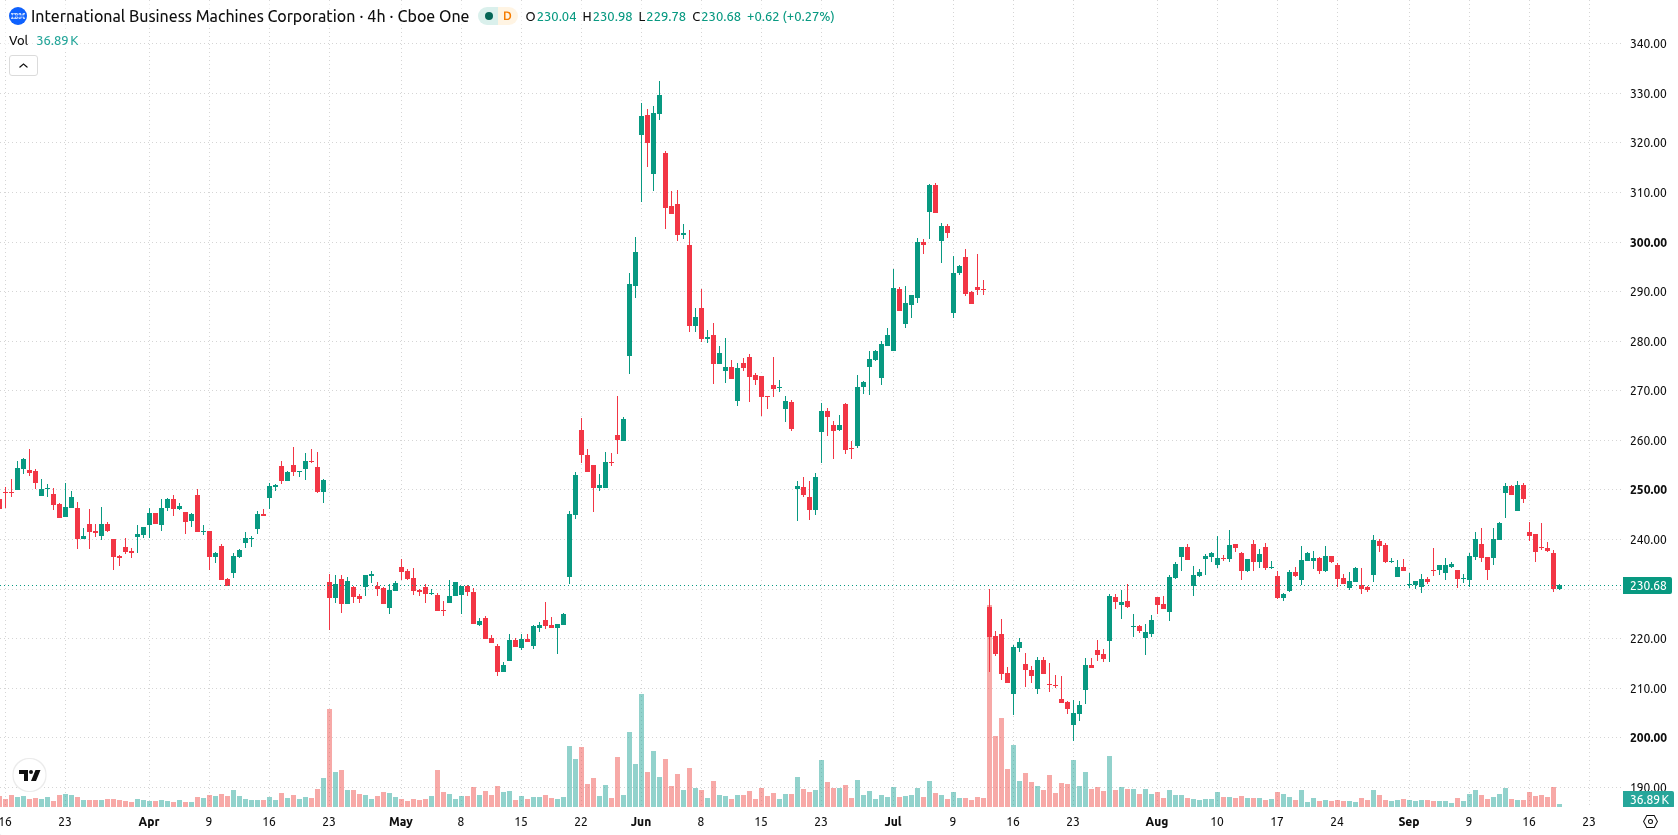
International Business Machines Corporation (IBM) fell 2.82% as ongoing selling pressure kept the stock below its 20-, 50-, and 200-day moving averages, with no fresh news or corporate catalysts in play. The bearish alignment of key moving averages and sustained intraday weakness supports the magnitude of today's decline.
 259.34
Highlights
- Shares of IBM have fallen 2.82% today and are trading near the session low after an upside gap at the open.
- The stock trades below its 20-day, 50-day, and 200-day moving averages, indicating sustained pressure across all timeframes.
- For the next five sessions, the expected range is $222.87 to $239.22 with a 56% probability of a downward move.
Mixed indicator signals as bearish structure meets volatile trading
IBM is trading below its 20-day, 50-day, and 200-day moving averages ($236.39, $233.51, and $260), signaling ongoing pressure from sellers across short-, medium-, and long-term timeframes. The near-term ceiling is at $233.51, with support at $222.87, and the structure remains bearish with the 50-day and 200-day averages still aligned downward. Momentum signals are mixed: the MACD gives a buy reading, while the ADX is neutral, suggesting weak trend conviction. Both RSI and CCI are in buy territory, but the Stochastic RSI is neutral. The BBP reveals buyers dominate intraday moves, yet with overbought warning, and the AO favors an upside bias. IBM dropped $6.71 or 2.82% today, opening with a $0.83 upside gap and trading near its session low. Intraday volatility is elevated at 2.54%. Sustained downside pressure has shaped today's weak intraday tone, with mixed momentum confirmation.
Previously, it was reported that IBM's technical and momentum indicators suggested a continued downside bias, with limited prospects for an immediate bullish reversal. The current price action and mixed momentum readings reinforce ongoing downside pressure, highlighting $222.87 as a critical support level to monitor for confirmation of further losses.










-
 Afghanistan
-
 Albania
-
 Algeria
-
 Angola
-
 Argentina
-
 Armenia
-
 Australia
-
 Austria
-
 Azerbaijan
-
 Bahamas
-
 Bahrain
-
 Bangladesh
-
 Belarus
-
 Belgium
-
 Bolivia
-
 Botswana
-
 Brazil
-
 Brunei
-
 Bulgaria
-
 Cambodia
-
 Cameroon
-
 Canada
-
 Chile
-
 China
-
 Colombia
-
 Congo
-
 Costa Rica
-
 Cote d'Ivoire
-
 Croatia
-
 Cuba
-
 Cyprus
-
 Czechia
-
 DR Congo
-
 Denmark
-
 Dominican Republic
-
 Ecuador
-
 Egypt
-
 El Salvador
-
 Estonia
-
 Eswatini
-
 Ethiopia
-
 Finland
-
 France
-
 Georgia
-
 Germany
-
 Ghana
-
 Greece
-
 Haiti
-
 Hong Kong
-
 Hungary
-
 India
-
 Indonesia
-
 Iran, Islamic republic
-
 Iraq
-
 Ireland
-
 Israel
-
 Italy
-
 Jamaica
-
 Japan
-
 Jordan
-
 Kazakhstan
-
 Kenya
-
 Korea
-
 Kuwait
-
 Kyrgyzstan
-
 Laos
-
 Latvia
-
 Lebanon
-
 Lesotho
-
 Libya
-
 Lithuania
-
 Luxembourg
-
 Madagascar
-
 Malaysia
-
 Malta
-
 Mauritius
-
 Mexico
-
 Moldova
-
 Mongolia
-
 Montenegro
-
 Morocco
-
 Mozambique
-
 Myanmar
-
 Namibia
-
 Nepal
-
 Netherlands
-
 New Zealand
-
 Nigeria
-
 North Macedonia
-
 Norway
-
 Oman
-
 Pakistan
-
 Palestine
-
 Panama
-
 Papua New Guinea
-
 Paraguay
-
 Peru
-
 Philippines
-
 Poland
-
 Portugal
-
 Puerto Rico
-
 Qatar
-
 Reunion
-
 Romania
-
 Rwanda
-
 Saudi Arabia
-
 Serbia
-
 Singapore
-
 Slovakia
-
 Slovenia
-
 Somalia
-
 South Africa
-
 Spain
-
 Sri Lanka
-
 Sweden
-
 Switzerland
-
 Syria
-
 Taiwan
-
 Tajikistan
-
 Tanzania
-
 Thailand
-
 Trinidad and Tobago
-
 Tunisia
-
 Turkey
-
 UAE
-
 Uganda
-
 Ukraine
-
 United Kingdom
-
United States
-
 Uruguay
-
 Uzbekistan
-
 Venezuela
-
 Vietnam
-
 Yemen
-
 Zambia
-
 Zimbabwe
- Forex
- Crypto












