

Private Wealth Asset Management LLC increases IBM stake: Can IBM extend its rebound?

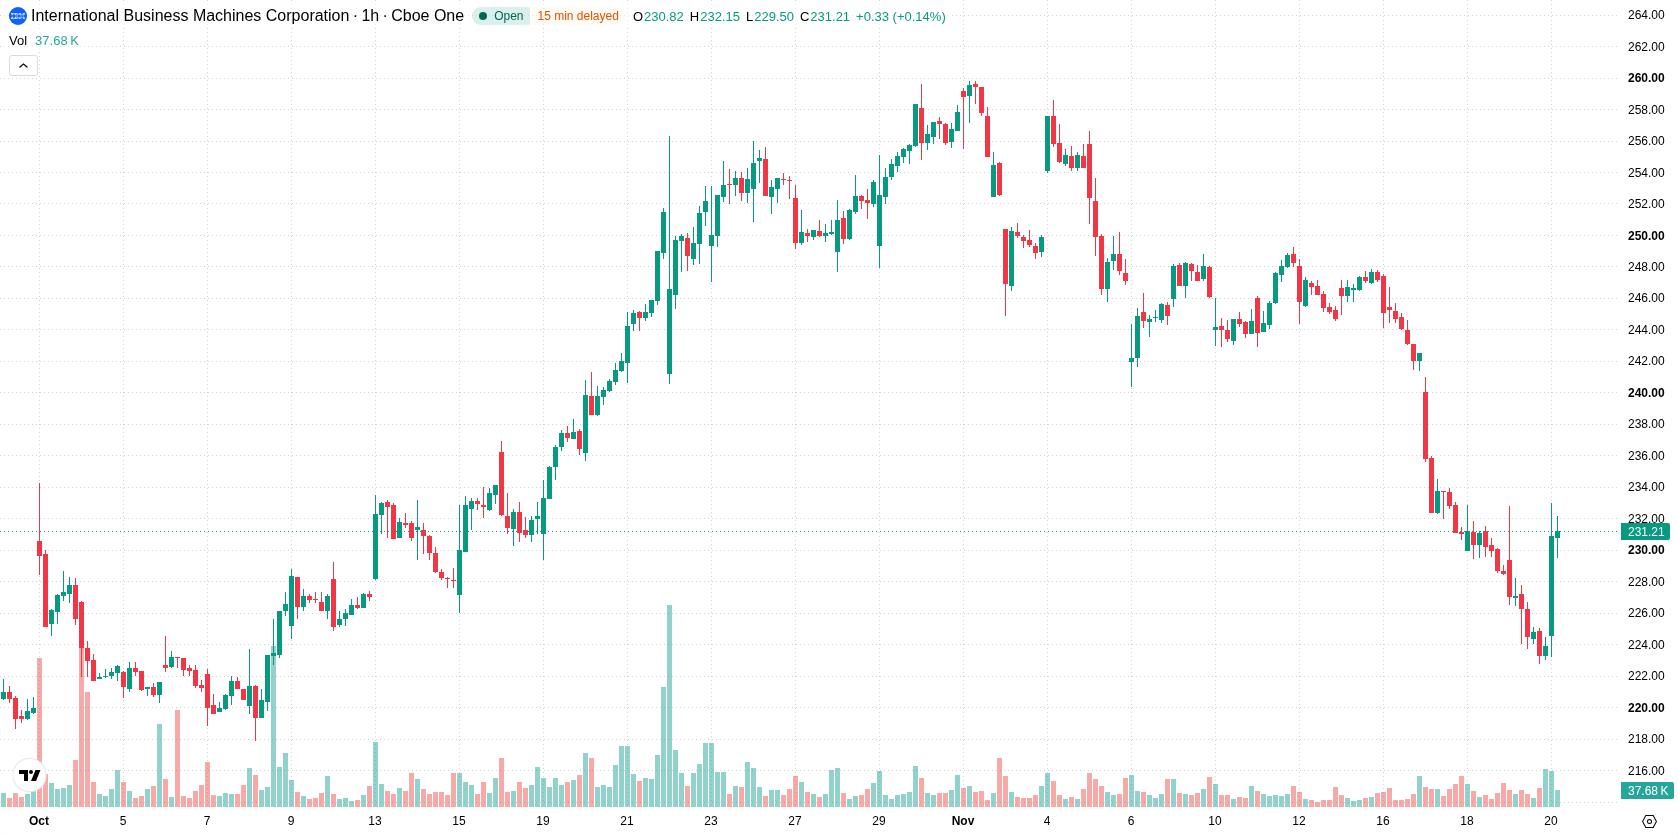
IBM (IBM) stock is trading at $231.9, recording a daily gain of 3.58%. The price currently sits above its short-term moving averages while remaining below medium- and longer-term averages, signaling a session marked by high volatility and an upward move.
 232.97
247.50
Highlights
- Private Wealth Asset Management LLC increased its IBM stock position by 16,929 shares in the third quarter, raising institutional demand.
- Private Advisor Group LLC raised its stake in IBM by 39.1%, while Bessemer Group Inc. reduced its position by 88.2%.
- IBM stock surged 3.58% to $231.9 on high volatility, with mixed technical signals and an expected $219.63 to $242.96 trading range.
Institutional accumulation strengthens upward pressure despite selective outflows
Private Wealth Asset Management LLC has significantly increased its position in IBM by adding 16,929 shares during the third quarter, according to MarketBeat, directly boosting institutional demand and supporting upward momentum. This move is complemented by Private Advisor Group LLC's decision to raise its holdings in IBM by 39.1% over the same period, indicating growing interest from institutional investors. At the same time, Bessemer Group Inc. reduced its holding by 88.2%, which partially offset these inflows but did not reverse overall accumulation pressures.
Bearish momentum prevails as resistance and volatility cap rebound
On the H1 timeframe, IBM trades above the H1 SMA-20 at $229.09 but remains below the H1 SMA-50 at $238.91 and the D1 SMA-200 at $245.3. The Ichimoku Kijun sits at $234.25 as immediate resistance overhead. Momentum indicators are largely bearish, with both MACD and ADX flashing sell signals. The H1 RSI and CCI are in oversold territory, while Stochastic RSI shows a neutral stance. Bull/Bear Power is negative, indicating dominance by sellers in the intraday window, and the Awesome Oscillator also reflects a bearish setup. High volatility is present, with the price rebounding sharply off the lows and some oscillators suggesting near-term selling exhaustion amid dominant downward momentum.
Sideways bias dominates as breakout risk shapes near-term outlook
Looking ahead to the next several sessions, IBM is expected to trade in a range between $219.63 and $242.96, consistent with the session's elevated volatility. There is a slightly higher probability (52%) of an upward move within this band. The baseline outlook calls for sideways price action inside these boundaries. A decisive break above the immediate resistance at $234.25 would open up room for additional gains, while a downside break below the lower support could lead to renewed bearish momentum and further declines.
Earlier, analysts noted that IBM remained under pressure due to broad technology sector declines, despite company-specific advancements in AI governance and cybersecurity. The current technical and institutional shifts highlight persistent volatility, making a sustained move above $234.25 a key signal for potential additional upside in the sessions ahead.






Latest IBM News




-
 Afghanistan
-
 Albania
-
 Algeria
-
 Angola
-
 Argentina
-
 Armenia
-
 Australia
-
 Austria
-
 Azerbaijan
-
 Bahamas
-
 Bahrain
-
 Bangladesh
-
 Belarus
-
 Belgium
-
 Bolivia
-
 Botswana
-
 Brazil
-
 Brunei
-
 Bulgaria
-
 Cambodia
-
 Cameroon
-
 Canada
-
 Chile
-
 China
-
 Colombia
-
 Congo
-
 Costa Rica
-
 Cote d'Ivoire
-
 Croatia
-
 Cuba
-
 Cyprus
-
 Czechia
-
 DR Congo
-
 Denmark
-
 Dominican Republic
-
 Ecuador
-
 Egypt
-
 El Salvador
-
 Estonia
-
 Eswatini
-
 Ethiopia
-
 Finland
-
 France
-
 Georgia
-
 Germany
-
 Ghana
-
 Greece
-
 Haiti
-
 Hong Kong
-
 Hungary
-
 India
-
 Indonesia
-
 Iran, Islamic republic
-
 Iraq
-
 Ireland
-
 Israel
-
 Italy
-
 Jamaica
-
 Japan
-
 Jordan
-
 Kazakhstan
-
 Kenya
-
 Korea
-
 Kuwait
-
 Kyrgyzstan
-
 Laos
-
 Latvia
-
 Lebanon
-
 Lesotho
-
 Libya
-
 Lithuania
-
 Luxembourg
-
 Madagascar
-
 Malaysia
-
 Malta
-
 Mauritius
-
 Mexico
-
 Moldova
-
 Mongolia
-
 Montenegro
-
 Morocco
-
 Mozambique
-
 Myanmar
-
 Namibia
-
 Nepal
-
 Netherlands
-
 New Zealand
-
 Nigeria
-
 North Macedonia
-
 Norway
-
 Oman
-
 Pakistan
-
 Palestine
-
 Panama
-
 Papua New Guinea
-
 Paraguay
-
 Peru
-
 Philippines
-
 Poland
-
 Portugal
-
 Puerto Rico
-
 Qatar
-
 Reunion
-
 Romania
-
 Rwanda
-
 Saudi Arabia
-
 Serbia
-
 Singapore
-
 Slovakia
-
 Slovenia
-
 Somalia
-
 South Africa
-
 Spain
-
 Sri Lanka
-
 Sweden
-
 Switzerland
-
 Syria
-
 Taiwan
-
 Tajikistan
-
 Tanzania
-
 Thailand
-
 Trinidad and Tobago
-
 Tunisia
-
 Turkey
-
 UAE
-
 Uganda
-
 Ukraine
-
 United Kingdom
-
United States
-
 Uruguay
-
 Uzbekistan
-
 Venezuela
-
 Vietnam
-
 Yemen
-
 Zambia
-
 Zimbabwe
- Forex
- Crypto












