

IBM shares fall over 2% as technical selling pressure dominates

International Business Machines Corporation (IBM) fell 2.01% amid persistent technical selling pressure and an absence of new fundamental catalysts. The move is supported by IBM's position below all major moving averages and the dominance of sellers across intraday and broader trend signals.
 232.76
247.77
Highlights
- Shares of IBM trade below all major trend levels, indicating seller dominance across short-, medium-, and long-term timeframes.
- Momentum indicators such as Stochastic RSI and CCI are in oversold zones, suggesting potential exhaustion of selling pressure.
- IBM stock is expected to range between $214.25 and $233.62 over the next five sessions with a 79% probability of a downward move.
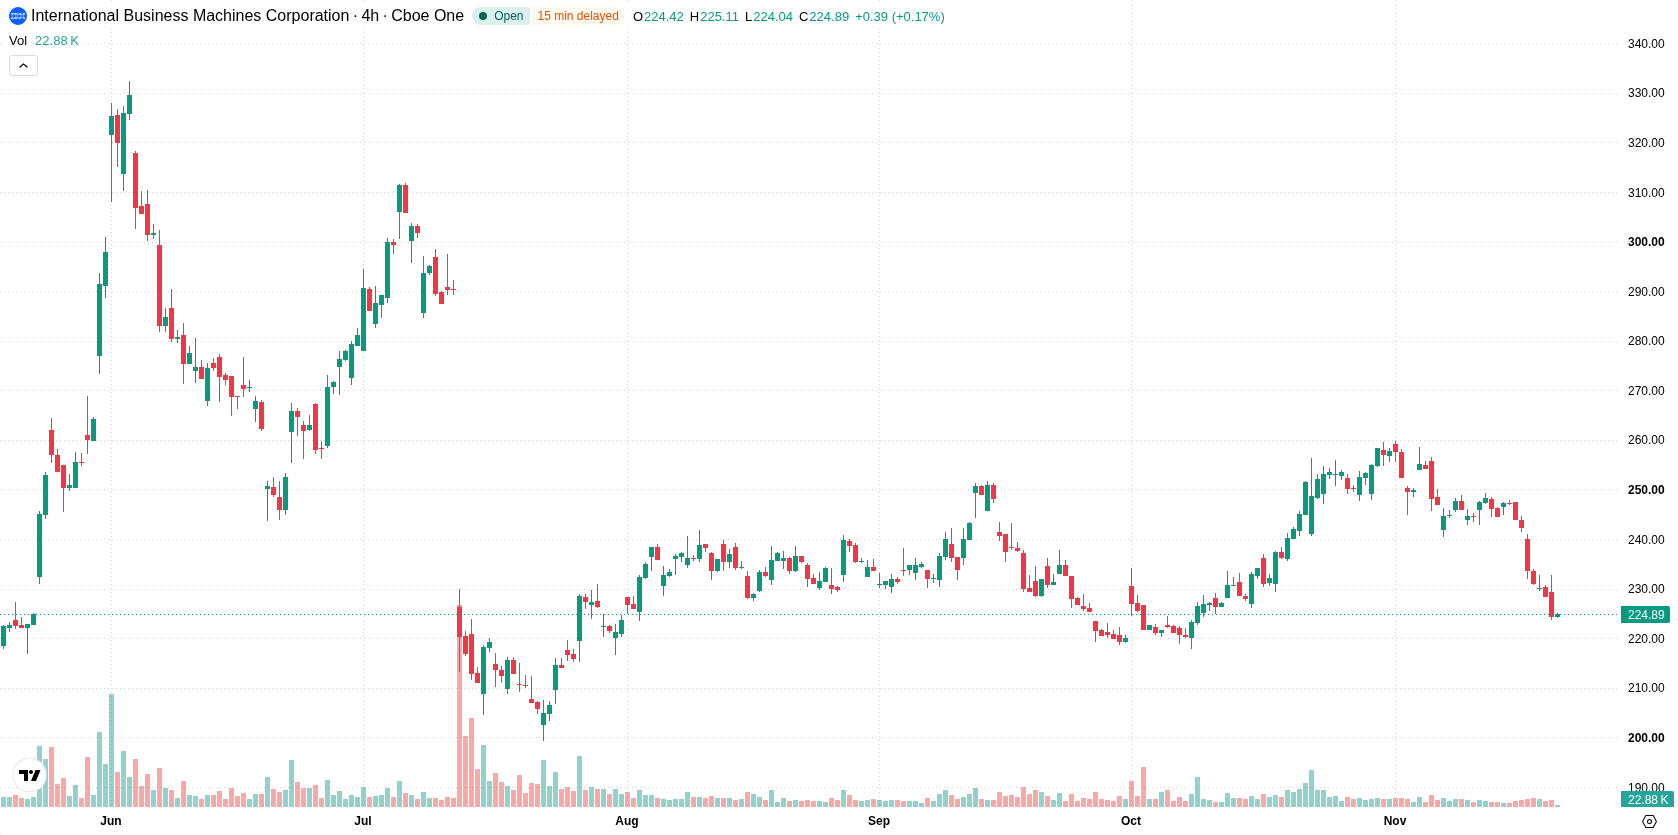
Bearish momentum persists as price remains below key averages
IBM remains below the 20-day, 50-day, and 200-day moving averages ($248.03, $237.94, and $245.63), confirming ongoing seller pressure across short-, medium-, and long-term timeframes. The price is trading between near-term support at $223.79 and resistance at $228.4, with all major trend levels above, highlighting a structurally bearish setup. Momentum indicators show limited directional conviction, with the RSI in a neutral zone. The Stochastic RSI and Commodity Channel Index (CCI) are in oversold territory, hinting at potential selling exhaustion. Both the MACD and Average Directional Index (ADX) are neutral, showing no strong trend shift, while the Bull/Bear Power (BBP) remains negative, reflecting intraday seller dominance. IBM is positioned near the session low with intraday volatility at 4.01%, indicating sustained downside pressure following a minor upside gap at the open.
Earlier, analysts noted that IBM's technical setup remained structurally bearish, with sellers maintaining control and downside risks dominating the outlook. The latest data confirms this prevailing negative bias, with the key level to watch now being a potential bearish breakdown below $223.79 that could open further downside toward $214.25.









-
 Afghanistan
-
 Albania
-
 Algeria
-
 Angola
-
 Argentina
-
 Armenia
-
 Australia
-
 Austria
-
 Azerbaijan
-
 Bahamas
-
 Bahrain
-
 Bangladesh
-
 Belarus
-
 Belgium
-
 Bolivia
-
 Botswana
-
 Brazil
-
 Brunei
-
 Bulgaria
-
 Cambodia
-
 Cameroon
-
 Canada
-
 Chile
-
 China
-
 Colombia
-
 Congo
-
 Costa Rica
-
 Cote d'Ivoire
-
 Croatia
-
 Cuba
-
 Cyprus
-
 Czechia
-
 DR Congo
-
 Denmark
-
 Dominican Republic
-
 Ecuador
-
 Egypt
-
 El Salvador
-
 Estonia
-
 Eswatini
-
 Ethiopia
-
 Finland
-
 France
-
 Georgia
-
 Germany
-
 Ghana
-
 Greece
-
 Haiti
-
 Hong Kong
-
 Hungary
-
 India
-
 Indonesia
-
 Iran, Islamic republic
-
 Iraq
-
 Ireland
-
 Israel
-
 Italy
-
 Jamaica
-
 Japan
-
 Jordan
-
 Kazakhstan
-
 Kenya
-
 Korea
-
 Kuwait
-
 Kyrgyzstan
-
 Laos
-
 Latvia
-
 Lebanon
-
 Lesotho
-
 Libya
-
 Lithuania
-
 Luxembourg
-
 Madagascar
-
 Malaysia
-
 Malta
-
 Mauritius
-
 Mexico
-
 Moldova
-
 Mongolia
-
 Montenegro
-
 Morocco
-
 Mozambique
-
 Myanmar
-
 Namibia
-
 Nepal
-
 Netherlands
-
 New Zealand
-
 Nigeria
-
 North Macedonia
-
 Norway
-
 Oman
-
 Pakistan
-
 Palestine
-
 Panama
-
 Papua New Guinea
-
 Paraguay
-
 Peru
-
 Philippines
-
 Poland
-
 Portugal
-
 Puerto Rico
-
 Qatar
-
 Reunion
-
 Romania
-
 Rwanda
-
 Saudi Arabia
-
 Serbia
-
 Singapore
-
 Slovakia
-
 Slovenia
-
 Somalia
-
 South Africa
-
 Spain
-
 Sri Lanka
-
 Sweden
-
 Switzerland
-
 Syria
-
 Taiwan
-
 Tajikistan
-
 Tanzania
-
 Thailand
-
 Trinidad and Tobago
-
 Tunisia
-
 Turkey
-
 UAE
-
 Uganda
-
 Ukraine
-
 United Kingdom
-
United States
-
 Uruguay
-
 Uzbekistan
-
 Venezuela
-
 Vietnam
-
 Yemen
-
 Zambia
-
 Zimbabwe
- Forex
- Crypto












