


International Business Machines Corporation (IBM) dropped 1.92% today as sustained selling pressure dominated both the short- and long-term outlooks. The move is reinforced by IBM trading below its 20-day, 50-day, and 200-day moving averages, with bearish technical alignment confirming the broader downtrend.
 241.00
249.21
Highlights
- Shares of IBM are trading below short-, medium-, and long-term moving averages, indicating persistent selling pressure across timeframes.
- Short-term momentum indicators are mixed, with MACD positive, but ADX, CCI, and RSI all neutral.
- IBM stock is expected to trade between $233.94 and $241.91 over the next five days, with a slight bias toward downside movement.
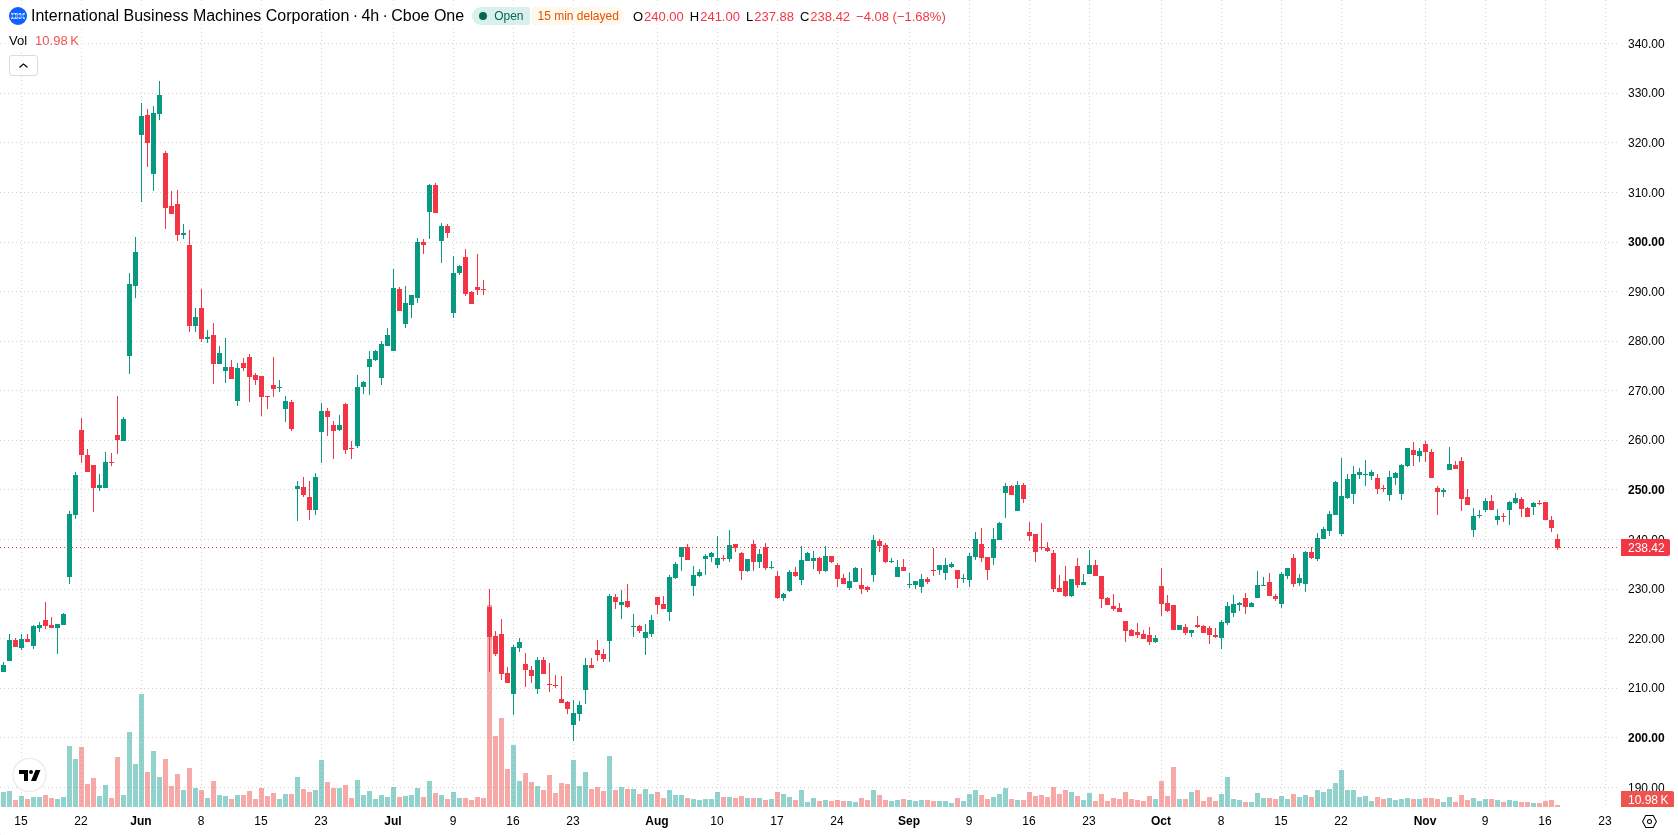
Mixed momentum masks bearish trend as technical signals diverge
IBM is trading below its 20-day, 50-day, and 200-day moving averages ($249.72, $238.19, and $246.38, respectively), indicating short-, medium-, and long-term selling pressure. The near-term ceiling stands at $238.19 and the near-term floor at $233.94, with the broader trend confirmed as bearish by the 50-day versus 200-day moving average alignment. Momentum signals present a mixed picture. The MACD points to strong buy momentum, but the Average Directional Index (ADX) is neutral, and the Commodity Channel Index (CCI) and Relative Strength Index (RSI) are both neutral. The Stochastic RSI is in the oversold zone, indicating potential for a rebound, while Bull/Bear Power (BBP) shows buyers dominate intraday action. The Awesome Oscillator remains neutral. The stock is down $4.67 or 1.92% today after opening on an upside gap of about 1.68%. It is trading near the session low, with intraday volatility at 2.31%. Overall, intraday trading shows pressure following the open, and short-term signals diverge between potential for rebound and ongoing seller pressure.
Earlier, analysts noted that while IBM was expanding its footprint in AI and cybersecurity, a stronger technical setup was still needed to confirm a shift in stock direction. The current alignment of moving averages and momentum indicators reinforces the prevailing bearish scenario, warranting close attention to a break below $233.94 as the next downside risk.






Latest IBM News




-
 Afghanistan
-
 Albania
-
 Algeria
-
 Angola
-
 Argentina
-
 Armenia
-
 Australia
-
 Austria
-
 Azerbaijan
-
 Bahamas
-
 Bahrain
-
 Bangladesh
-
 Belarus
-
 Belgium
-
 Bolivia
-
 Botswana
-
 Brazil
-
 Brunei
-
 Bulgaria
-
 Cambodia
-
 Cameroon
-
 Canada
-
 Chile
-
 China
-
 Colombia
-
 Congo
-
 Costa Rica
-
 Cote d'Ivoire
-
 Croatia
-
 Cuba
-
 Cyprus
-
 Czechia
-
 DR Congo
-
 Denmark
-
 Dominican Republic
-
 Ecuador
-
 Egypt
-
 El Salvador
-
 Estonia
-
 Eswatini
-
 Ethiopia
-
 Finland
-
 France
-
 Georgia
-
 Germany
-
 Ghana
-
 Greece
-
 Haiti
-
 Hong Kong
-
 Hungary
-
 India
-
 Indonesia
-
 Iran, Islamic republic
-
 Iraq
-
 Ireland
-
 Israel
-
 Italy
-
 Jamaica
-
 Japan
-
 Jordan
-
 Kazakhstan
-
 Kenya
-
 Korea
-
 Kuwait
-
 Kyrgyzstan
-
 Laos
-
 Latvia
-
 Lebanon
-
 Lesotho
-
 Libya
-
 Lithuania
-
 Luxembourg
-
 Madagascar
-
 Malaysia
-
 Malta
-
 Mauritius
-
 Mexico
-
 Moldova
-
 Mongolia
-
 Montenegro
-
 Morocco
-
 Mozambique
-
 Myanmar
-
 Namibia
-
 Nepal
-
 Netherlands
-
 New Zealand
-
 Nigeria
-
 North Macedonia
-
 Norway
-
 Oman
-
 Pakistan
-
 Palestine
-
 Panama
-
 Papua New Guinea
-
 Paraguay
-
 Peru
-
 Philippines
-
 Poland
-
 Portugal
-
 Puerto Rico
-
 Qatar
-
 Reunion
-
 Romania
-
 Rwanda
-
 Saudi Arabia
-
 Serbia
-
 Singapore
-
 Slovakia
-
 Slovenia
-
 Somalia
-
 South Africa
-
 Spain
-
 Sri Lanka
-
 Sweden
-
 Switzerland
-
 Syria
-
 Taiwan
-
 Tajikistan
-
 Tanzania
-
 Thailand
-
 Trinidad and Tobago
-
 Tunisia
-
 Turkey
-
 UAE
-
 Uganda
-
 Ukraine
-
 United Kingdom
-
United States
-
 Uruguay
-
 Uzbekistan
-
 Venezuela
-
 Vietnam
-
 Yemen
-
 Zambia
-
 Zimbabwe
- Forex
- Crypto












