

IBM stock falls amid weak momentum and pressure toward $224.84 support

IBM (IBM) stock is trading at $232.92, down 3.95% on the day. The price is positioned below its key moving averages, indicating bearish momentum relative to recent trends.
 241.00
249.21
Highlights
- IBM raised its free cash flow growth target and reported $3 billion in quarterly free cash flow, indicating improved operational metrics.
- Institutional flows were mixed in the third quarter, with Phoenix Financial Ltd. and Cullen Capital Management LLC increasing stakes, while Intech Investment Management LLC cut its position.
- IBM stock trades below key moving averages and technical indicators signal strong bearish momentum, with a projected trading range of $224.84 to $236.44 and a 79% likelihood of further downside.
Dividend support limited as institutional flows show mixed commitment
IBM raised its free cash flow growth target and reported $3 billion in quarterly free cash flow, reflecting strengthened operational performance and ongoing income generation, according to Seeking Alpha. The approximately 2.8% dividend yield may offer some support to long-term holders but has not reversed selling momentum in the current session. Institutional holdings shifted unevenly in the third quarter, with Phoenix Financial Ltd. and Cullen Capital Management LLC increasing their stakes, while Intech Investment Management LLC significantly reduced its position, as reported by Themarketsdaily and MarketBeat.
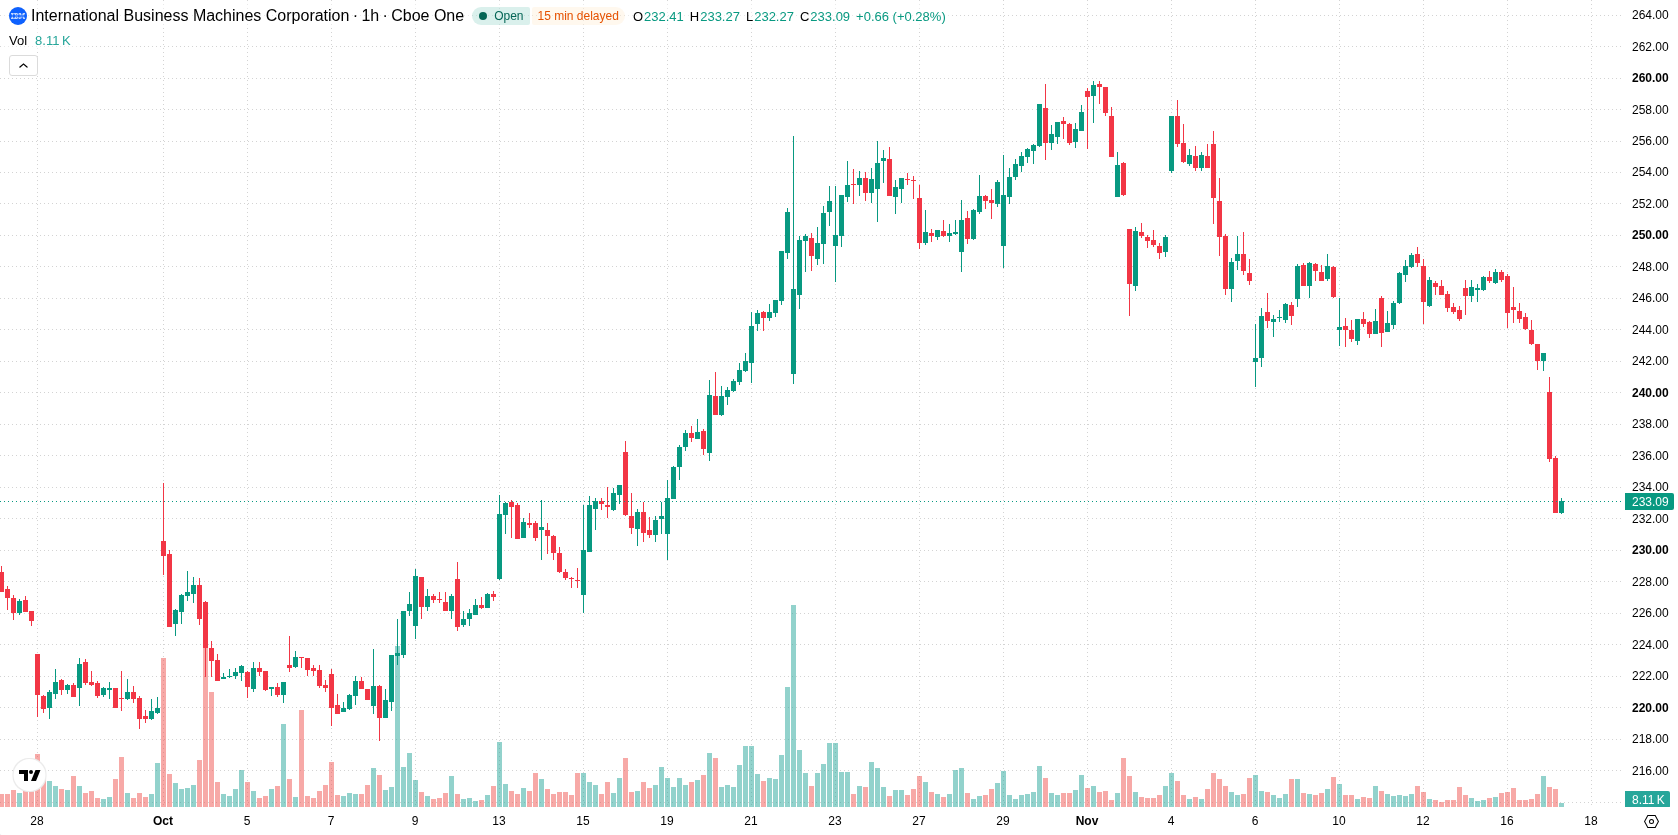
Oversold conditions deepen as sellers dominate below resistance
On the technical front, IBM is trading below the H1 SMA-20 at $244.32, H1 SMA-50 at $245.26, and D1 SMA-200 at $246.38. The Ichimoku Kijun at $241.29 serves as immediate resistance. Momentum indicators are decisively negative: both MACD and ADX signal a sell bias, while Bull/Bear Power is deeply negative at -5.99, confirming that sellers are dominating near-term action. RSI, Stoch RSI, and CCI have all entered the oversold zone, suggesting that the market has been heavily sold and that selling momentum could be approaching exhaustion. The Awesome Oscillator continues to reinforce the prevailing downtrend.
Downside bias prevails as volatility contains rebound risk
Over the next two to three trading days, IBM is likely to remain within a volatile range between $224.84 and $236.44, reflecting the current volatility band relative to existing levels. With only a 21% probability assigned to a short-term rebound versus a 79% likelihood of further declines, the risk skew remains to the downside. The base case scenario expects continued rangebound price action inside these levels, while a bullish breakout would require a decisive move above the $241.29 resistance. If bearish momentum persists, IBM could break below $224.84 and extend recent losses.
Earlier, analysts noted that IBM’s technical picture remained bearish, marked by sustained selling pressure and alignment of key moving averages to the downside. The current article confirms this negative outlook with new momentum data and oversold signals, highlighting that continued downside risk persists unless IBM can reclaim and hold above $241.29 in the near term.






Latest IBM News




-
 Afghanistan
-
 Albania
-
 Algeria
-
 Angola
-
 Argentina
-
 Armenia
-
 Australia
-
 Austria
-
 Azerbaijan
-
 Bahamas
-
 Bahrain
-
 Bangladesh
-
 Belarus
-
 Belgium
-
 Bolivia
-
 Botswana
-
 Brazil
-
 Brunei
-
 Bulgaria
-
 Cambodia
-
 Cameroon
-
 Canada
-
 Chile
-
 China
-
 Colombia
-
 Congo
-
 Costa Rica
-
 Cote d'Ivoire
-
 Croatia
-
 Cuba
-
 Cyprus
-
 Czechia
-
 DR Congo
-
 Denmark
-
 Dominican Republic
-
 Ecuador
-
 Egypt
-
 El Salvador
-
 Estonia
-
 Eswatini
-
 Ethiopia
-
 Finland
-
 France
-
 Georgia
-
 Germany
-
 Ghana
-
 Greece
-
 Haiti
-
 Hong Kong
-
 Hungary
-
 India
-
 Indonesia
-
 Iran, Islamic republic
-
 Iraq
-
 Ireland
-
 Israel
-
 Italy
-
 Jamaica
-
 Japan
-
 Jordan
-
 Kazakhstan
-
 Kenya
-
 Korea
-
 Kuwait
-
 Kyrgyzstan
-
 Laos
-
 Latvia
-
 Lebanon
-
 Lesotho
-
 Libya
-
 Lithuania
-
 Luxembourg
-
 Madagascar
-
 Malaysia
-
 Malta
-
 Mauritius
-
 Mexico
-
 Moldova
-
 Mongolia
-
 Montenegro
-
 Morocco
-
 Mozambique
-
 Myanmar
-
 Namibia
-
 Nepal
-
 Netherlands
-
 New Zealand
-
 Nigeria
-
 North Macedonia
-
 Norway
-
 Oman
-
 Pakistan
-
 Palestine
-
 Panama
-
 Papua New Guinea
-
 Paraguay
-
 Peru
-
 Philippines
-
 Poland
-
 Portugal
-
 Puerto Rico
-
 Qatar
-
 Reunion
-
 Romania
-
 Rwanda
-
 Saudi Arabia
-
 Serbia
-
 Singapore
-
 Slovakia
-
 Slovenia
-
 Somalia
-
 South Africa
-
 Spain
-
 Sri Lanka
-
 Sweden
-
 Switzerland
-
 Syria
-
 Taiwan
-
 Tajikistan
-
 Tanzania
-
 Thailand
-
 Trinidad and Tobago
-
 Tunisia
-
 Turkey
-
 UAE
-
 Uganda
-
 Ukraine
-
 United Kingdom
-
United States
-
 Uruguay
-
 Uzbekistan
-
 Venezuela
-
 Vietnam
-
 Yemen
-
 Zambia
-
 Zimbabwe
- Forex
- Crypto












