

What's behind Amphenol's latest 4.3% stock surge?

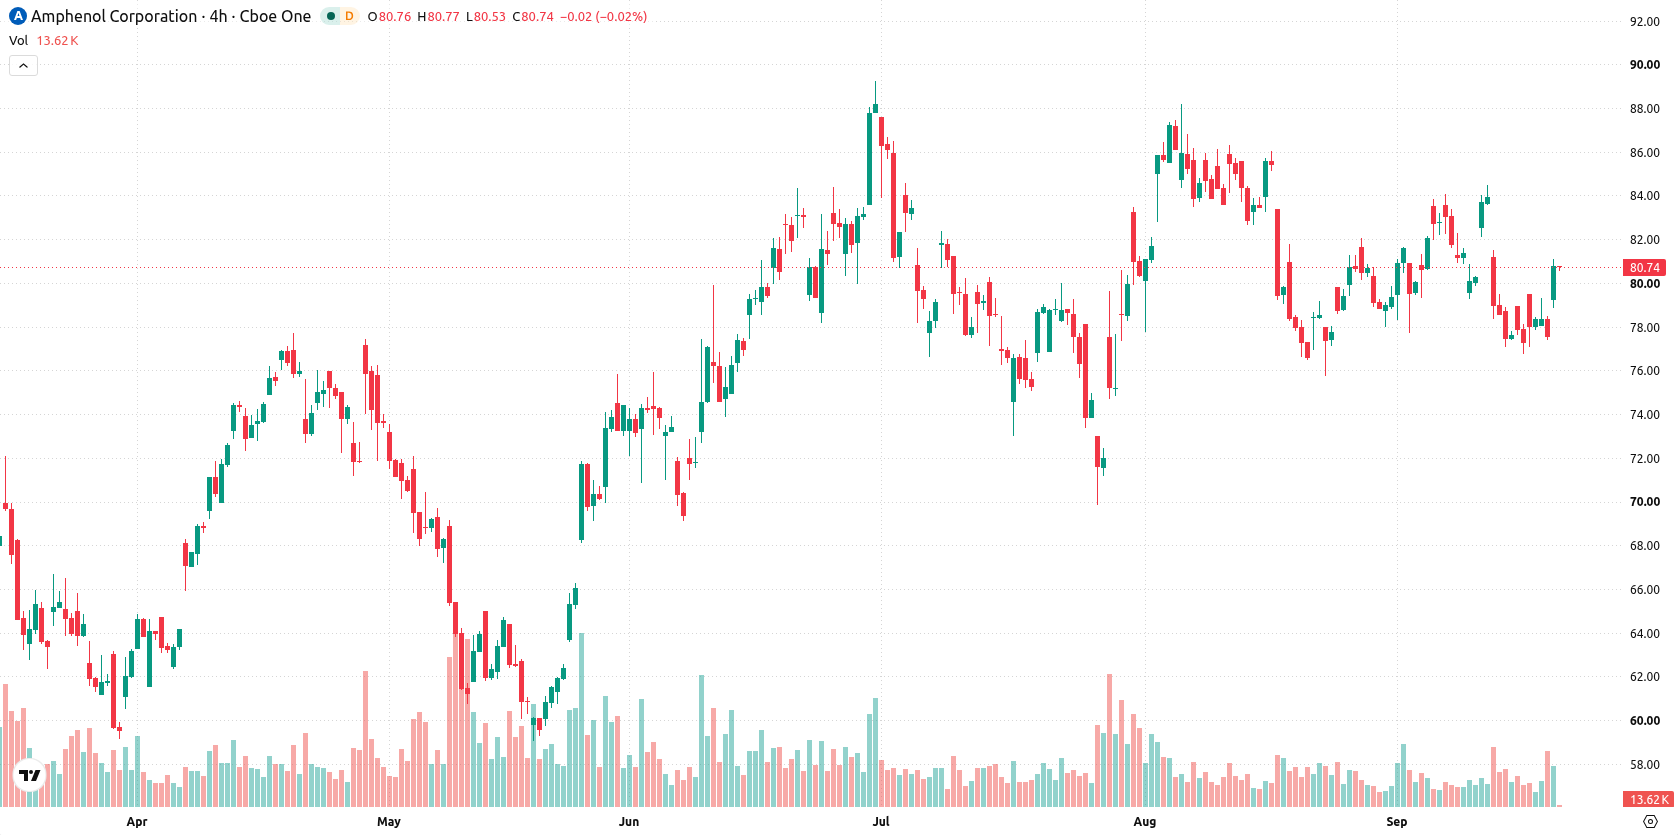
Amphenol Corporation (APH) climbed 4.3% after confirming its upcoming quarterly dividend, with ongoing shareholder rewards following a recent 2-for-1 stock split. The upmove looks limited, as the stock remains below both its 20-day and 50-day moving averages, signaling continued near-term and medium-term pressure.
 87.08
89.89
87.08
89.89
Highlights
- Amphenol stock goes ex-dividend on September 22, 2026, granting holders a $0.125 cash payment on October 14, 2026.
- The distribution follows a 2-for-1 stock split and recent SEC filings, maintaining Amphenol's pattern of regular shareholder returns.
- Shares of Amphenol currently trade below key moving averages with technical signals indicating ongoing selling pressure and a probable short-term consolidation in the $79.69 to $82.21 range.
Shareholder rewards reinforced as ex-dividend date follows stock split
Amphenol is set to trade ex-dividend on September 22, 2026, entitling shareholders of record to a $0.125 cash dividend payable on October 14, 2026. This distribution aligns with the company’s established payout schedule and follows a recent 2-for-1 stock split accompanied by formal SEC filings. These corporate actions reinforce Amphenol’s commitment to regular shareholder returns.
Selling pressure dominates as shares lag key moving averages
Amphenol is currently trading below both its 20-day and 50-day moving averages, with the price at $80.95 against the MA-20 at $83.92 and the MA-50 at $81.56, suggesting near-term selling pressure and a weakening medium-term trend. However, the price remains above the 200-day moving average at $73.79, supported by a bullish longer-term alignment, with the nearest resistance at $81.56 and a support floor at today’s high of $80. Momentum signals are broadly negative: both the Moving Average Convergence Divergence (MACD) and the Commodity Channel Index (CCI) point toward selling pressure, while the Relative Strength Index (RSI) sits at 47.11, suggesting a mild bias to the downside. The Stochastic RSI and Bull/Bear Power (BBP) indicate oversold conditions, with BBP’s value highlighting that sellers currently dominate intraday momentum. The Awesome Oscillator (AO) also supports the selling trend. The stock trades at $80.95, up $3.34 or 4.3% on the day after an upside gap of roughly $1.65 (2.13%), currently near the session high. Intraday volatility stands at 0.93%, with strong action toward the upper end of today’s range, despite lagging momentum signals and a potential short-term divergence.
Previously it was reported that Amphenol’s price action showed ongoing technical weakness despite support from its long-term trend. The latest developments confirm continued near- to medium-term pressure, and traders should monitor the $81.56 resistance as a potential pivot for any reversal in momentum.











-
 Afghanistan
-
 Albania
-
 Algeria
-
 Angola
-
 Argentina
-
 Armenia
-
 Australia
-
 Austria
-
 Azerbaijan
-
 Bahamas
-
 Bahrain
-
 Bangladesh
-
 Belarus
-
 Belgium
-
 Bolivia
-
 Botswana
-
 Brazil
-
 Brunei
-
 Bulgaria
-
 Cambodia
-
 Cameroon
-
 Canada
-
 Chile
Chile
-
 China
China
-
 Colombia
-
 Congo
Congo
-
 Costa Rica
-
 Cote d'Ivoire
-
 Croatia
-
 Cuba
Cuba
-
 Cyprus
-
 Czechia
-
 DR Congo
-
 Denmark
-
 Dominican Republic
-
 Ecuador
-
 Egypt
Egypt
-
 El Salvador
-
 Estonia
-
 Eswatini
-
 Ethiopia
-
 Finland
-
 France
-
 Georgia
-
 Germany
-
 Ghana
Ghana
-
 Greece
-
 Haiti
Haiti
-
 Hong Kong
-
 Hungary
-
 India
India
-
 Indonesia
-
 Iran, Islamic republic
-
 Iraq
Iraq
-
 Ireland
-
 Israel
-
 Italy
Italy
-
 Jamaica
-
 Japan
Japan
-
 Jordan
-
 Kazakhstan
-
 Kenya
Kenya
-
 Korea
Korea
-
 Kuwait
-
 Kyrgyzstan
-
 Laos
Laos
-
 Latvia
-
 Lebanon
-
 Lesotho
-
 Libya
Libya
-
 Lithuania
-
 Luxembourg
-
 Madagascar
-
 Malaysia
-
 Malta
Malta
-
 Mauritius
-
 Mexico
-
 Moldova
-
 Mongolia
-
 Montenegro
-
 Morocco
-
 Mozambique
-
 Myanmar
-
 Namibia
-
 Nepal
Nepal
-
 Netherlands
-
 New Zealand
-
 Nigeria
-
 North Macedonia
-
 Norway
-
 Oman
Oman
-
 Pakistan
-
 Palestine
-
 Panama
-
 Papua New Guinea
-
 Paraguay
-
 Peru
Peru
-
 Philippines
-
 Poland
-
 Portugal
-
 Puerto Rico
-
 Qatar
Qatar
-
 Reunion
-
 Romania
-
 Rwanda
-
 Saudi Arabia
-
 Serbia
-
 Singapore
-
 Slovakia
-
 Slovenia
-
 Somalia
-
 South Africa
-
 Spain
Spain
-
 Sri Lanka
-
 Sweden
-
 Switzerland
-
 Syria
Syria
-
 Taiwan
-
 Tajikistan
-
 Tanzania
-
 Thailand
-
 Trinidad and Tobago
-
 Tunisia
-
 Turkey
-
 UAE
UAE
-
 Uganda
-
 Ukraine
-
 United Kingdom
-
United States
-
 Uruguay
-
 Uzbekistan
-
 Venezuela
-
 Vietnam
-
 Yemen
Yemen
-
 Zambia
-
 Zimbabwe
- Forex
- Crypto












