

Amphenol stock forecast: Rebound continues with sellers capping gains near resistance

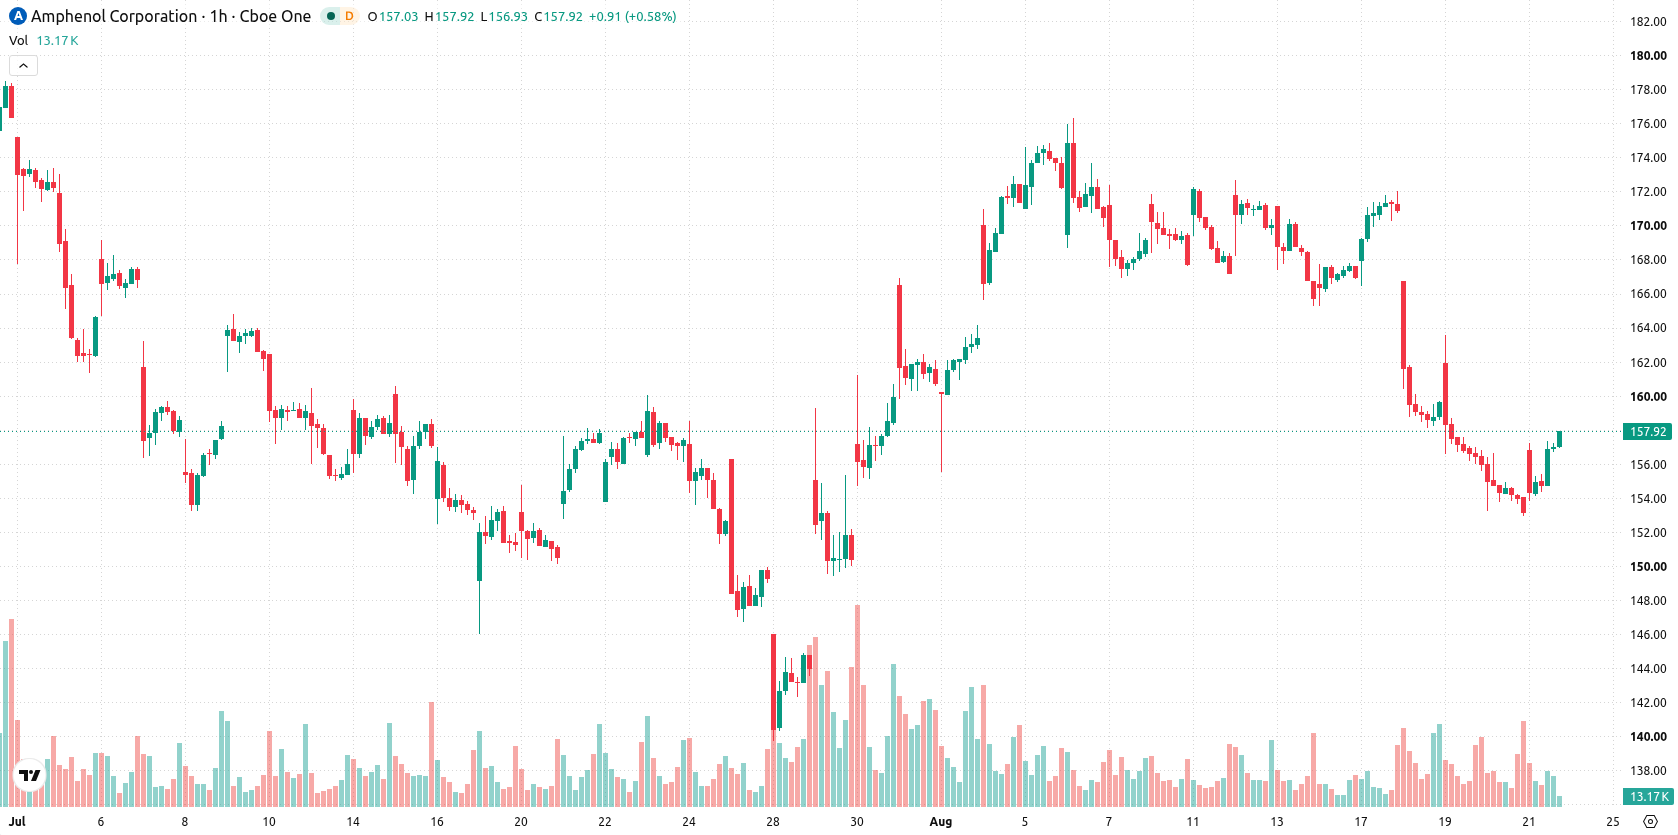
Amphenol (APH) stock is trading at $157.82, up 3.08% on the day and opening with a 2.55 gap higher. The daily price is holding above its key short-term moving average but remains capped by intermediate-term sellers, while staying well above its long-term trend average.
 86.13
88.24
86.13
88.24
Highlights
- APH/USD closed at $157.82, up 3.08%, with a gap higher at the open and moderate volatility.
- Short-term bullish momentum prevails above major support, but the price struggles to overcome medium-term resistance at $162.49.
- Momentum signals are mixed and overbought readings dominate, with a 65% probability for a move down toward $149.22 in the next 2 to 3 days.
Mixed momentum signals as near-term resistance limits upside
On the hourly chart, APH is positioned above the MA-20 ($155.96) and well above the long-term MA-200 ($144.54), but remains below the MA-50 ($162.83). The Ichimoku Kijun at $162.49 forms the immediate resistance to the upside. Key support is established at $149.22, with resistance at $166.42. MACD and ADX both signal sell pressure, while RSI prints 40.96 (Sell) and Stochastic RSI is in overbought territory. CCI is Neutral, and Bull/Bear Power indicates intraday buyer prevalence, though this diverges from the broader momentum picture.
Downside risk dominates as price oscillates within volatility band
Over the next 2–3 trading days, APH is expected to oscillate within a volatility band of $149.22 to $166.42. There is a 35% probability of an upward breakout above $162.49, which could lead to a test of the upper range. However, the dominant scenario is a 65% chance of a move lower, with a slip below $149.22 likely to signal further downside. Baseline expectations remain for sideways action between key support and resistance levels.
Previously it was reported that Amphenol faced ongoing technical weakness despite its long-term uptrend remaining intact. With new short-term price stability emerging above support, traders should monitor the potential for a shift in the prevailing range, particularly if momentum builds toward a breakout above $162.49 or a breakdown below $149.22.





Latest Amphenol News






-
 Afghanistan
-
 Albania
-
 Algeria
-
 Angola
-
 Argentina
-
 Armenia
-
 Australia
-
 Austria
-
 Azerbaijan
-
 Bahamas
-
 Bahrain
-
 Bangladesh
-
 Belarus
-
 Belgium
-
 Bolivia
-
 Botswana
-
 Brazil
-
 Brunei
-
 Bulgaria
-
 Cambodia
-
 Cameroon
-
 Canada
-
 Chile
Chile
-
 China
China
-
 Colombia
-
 Congo
Congo
-
 Costa Rica
-
 Cote d'Ivoire
-
 Croatia
-
 Cuba
Cuba
-
 Cyprus
-
 Czechia
-
 DR Congo
-
 Denmark
-
 Dominican Republic
-
 Ecuador
-
 Egypt
Egypt
-
 El Salvador
-
 Estonia
-
 Eswatini
-
 Ethiopia
-
 Finland
-
 France
-
 Georgia
-
 Germany
-
 Ghana
Ghana
-
 Greece
-
 Haiti
Haiti
-
 Hong Kong
-
 Hungary
-
 India
India
-
 Indonesia
-
 Iran, Islamic republic
-
 Iraq
Iraq
-
 Ireland
-
 Israel
-
 Italy
Italy
-
 Jamaica
-
 Japan
Japan
-
 Jordan
-
 Kazakhstan
-
 Kenya
Kenya
-
 Korea
Korea
-
 Kuwait
-
 Kyrgyzstan
-
 Laos
Laos
-
 Latvia
-
 Lebanon
-
 Lesotho
-
 Libya
Libya
-
 Lithuania
-
 Luxembourg
-
 Madagascar
-
 Malaysia
-
 Malta
Malta
-
 Mauritius
-
 Mexico
-
 Moldova
-
 Mongolia
-
 Montenegro
-
 Morocco
-
 Mozambique
-
 Myanmar
-
 Namibia
-
 Nepal
Nepal
-
 Netherlands
-
 New Zealand
-
 Nigeria
-
 North Macedonia
-
 Norway
-
 Oman
Oman
-
 Pakistan
-
 Palestine
-
 Panama
-
 Papua New Guinea
-
 Paraguay
-
 Peru
Peru
-
 Philippines
-
 Poland
-
 Portugal
-
 Puerto Rico
-
 Qatar
Qatar
-
 Reunion
-
 Romania
-
 Rwanda
-
 Saudi Arabia
-
 Serbia
-
 Singapore
-
 Slovakia
-
 Slovenia
-
 Somalia
-
 South Africa
-
 Spain
Spain
-
 Sri Lanka
-
 Sweden
-
 Switzerland
-
 Syria
Syria
-
 Taiwan
-
 Tajikistan
-
 Tanzania
-
 Thailand
-
 Trinidad and Tobago
-
 Tunisia
-
 Turkey
-
 UAE
UAE
-
 Uganda
-
 Ukraine
-
 United Kingdom
-
United States
-
 Uruguay
-
 Uzbekistan
-
 Venezuela
-
 Vietnam
-
 Yemen
Yemen
-
 Zambia
-
 Zimbabwe
- Forex
- Crypto












