

Exxon Mobil stock decline stretches into oversold territory as sellers lose dominance: weekly analysis

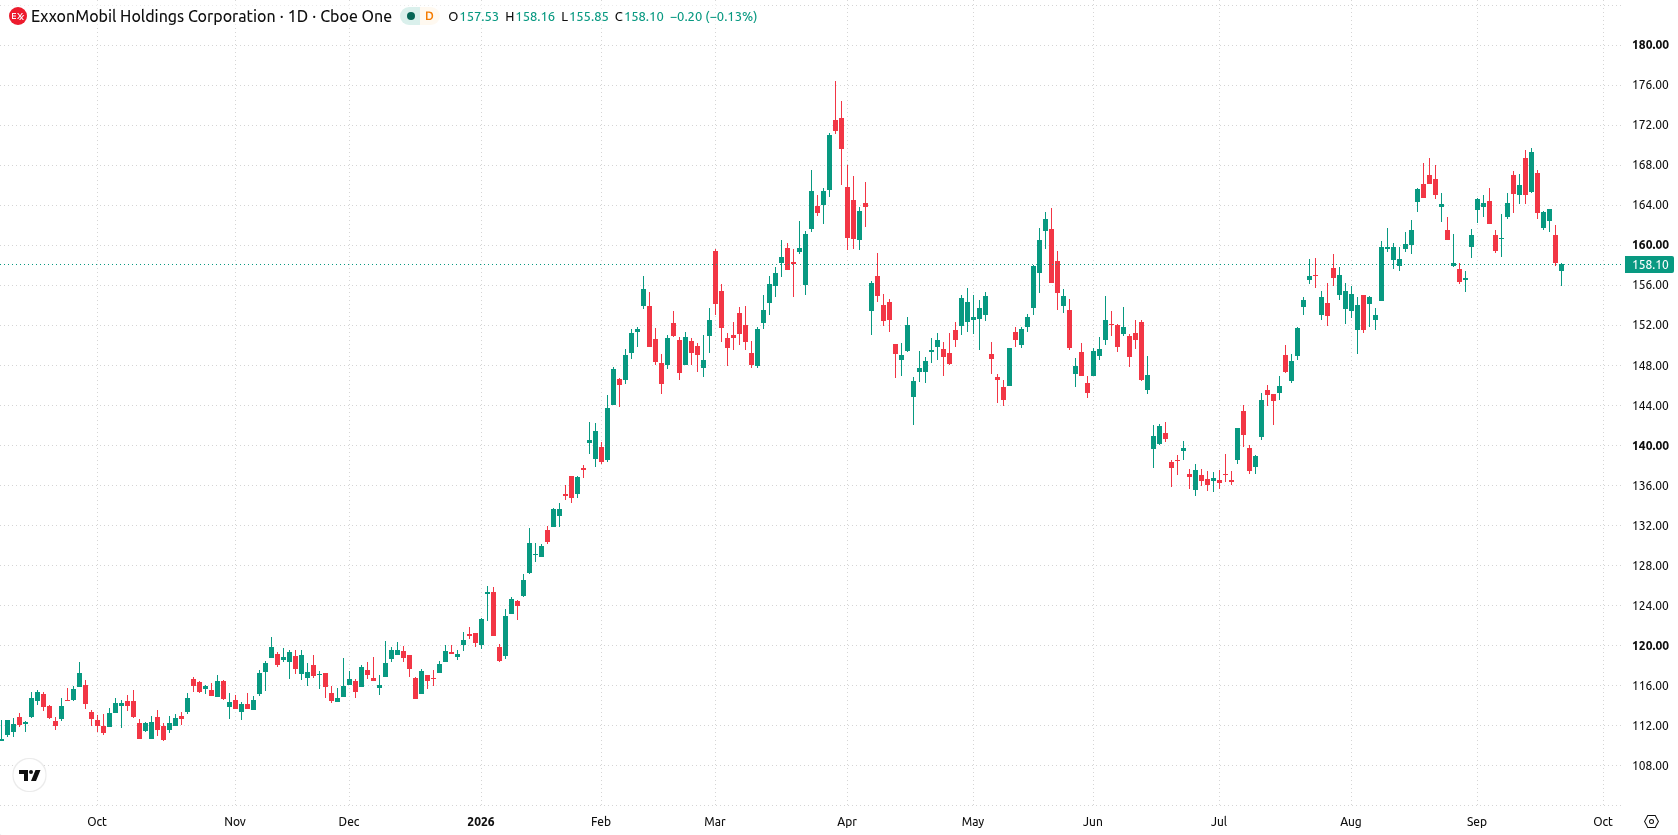
Shares of Exxon Mobil Corporation (XOM) are trading near $159 after slipping nearly 3% over the past week, as a sustained decline stretches the technical setup into oversold territory. The daily chart shows mixed momentum signals and strong contest at key moving averages, highlighting a market struggling for clear direction into the week ahead.
 180.30
187.90
Highlights
- Shares of Exxon Mobil fell 2.89% over the past 7 days to $158.65, holding at their 50-day average.
- Technical indicators show mixed short-term momentum with oversold signals but MACD maintaining a buy stance.
- Exxon Mobil stock is expected to consolidate between $158.16 support and $162.28 resistance, with a 52% chance of a decline.
Post-acquisition debt actions and carbon capture deals lift sentiment this week
Exxon Mobil completed cash tender offers for $1.18 billion in Pioneer Natural Resources debt as part of its post-acquisition debt management, resulting in a positive market reaction according to Blockonomi. The company advanced its carbon capture efforts, securing contracts to store about nine million metric tons of CO2 annually, with new projects expected to come online by 2027. Management also participated in the Morgan Stanley annual Laguna Conference, discussing refining, supply chain strategies, and capital returns.
Support levels hold as mixed momentum persists in narrow weekly range
The daily chart structure shows price action pinned to the 50-day moving average, with resistance defined by the 20-day average and Ichimoku Kijun near $162.28—$162.47. Short-term momentum signals are mixed: Stochastic RSI sits in oversold, but MACD maintains a buy stance at 1.31. Bull/Bear Power also registers an oversold reading, suggesting waning seller dominance. Volatility over the past week ran at 5.24%, and the momentum character is a contained move within a narrow range.
Consolidation bias remains unless breakout occurs above resistance or below support
In the week ahead, Exxon Mobil is expected to trade between $148.44 and $162.34, with a 48% probability of an increase and a 52% probability of a decrease. Base case is for continued consolidation between the 50-day support at $158.16 and resistance at $162.28. A sustained push above $162.28 would clear the way for a test of the upper part of the expected range, while a drop below $158.16 would open the door for a move toward $148.44.
Earlier, analysts noted that Exxon's technical momentum was mixed, with gains limited by persistent resistance and broader selling pressure in the stock. The latest developments—highlighting post-acquisition debt management and progress in carbon capture projects—add a new dimension to the outlook, with the key level to watch remaining a sustained move above $162.28 to signal further upside potential.











-
 Afghanistan
-
 Albania
-
 Algeria
-
 Angola
-
 Argentina
-
 Armenia
-
 Australia
-
 Austria
-
 Azerbaijan
-
 Bahamas
-
 Bahrain
-
 Bangladesh
-
 Belarus
-
 Belgium
-
 Bolivia
-
 Botswana
-
 Brazil
-
 Brunei
-
 Bulgaria
-
 Cambodia
-
 Cameroon
-
 Canada
-
 Chile
-
 China
-
 Colombia
-
 Congo
-
 Costa Rica
-
 Cote d'Ivoire
-
 Croatia
-
 Cuba
-
 Cyprus
-
 Czechia
-
 DR Congo
-
 Denmark
-
 Dominican Republic
-
 Ecuador
-
 Egypt
-
 El Salvador
-
 Estonia
-
 Eswatini
-
 Ethiopia
-
 Finland
-
 France
-
 Georgia
-
 Germany
-
 Ghana
-
 Greece
-
 Haiti
-
 Hong Kong
-
 Hungary
-
 India
-
 Indonesia
-
 Iran, Islamic republic
-
 Iraq
-
 Ireland
-
 Israel
-
 Italy
-
 Jamaica
-
 Japan
-
 Jordan
-
 Kazakhstan
-
 Kenya
-
 Korea
-
 Kuwait
-
 Kyrgyzstan
-
 Laos
-
 Latvia
-
 Lebanon
-
 Lesotho
-
 Libya
-
 Lithuania
-
 Luxembourg
-
 Madagascar
-
 Malaysia
-
 Malta
-
 Mauritius
-
 Mexico
-
 Moldova
-
 Mongolia
-
 Montenegro
-
 Morocco
-
 Mozambique
-
 Myanmar
-
 Namibia
-
 Nepal
-
 Netherlands
-
 New Zealand
-
 Nigeria
-
 North Macedonia
-
 Norway
-
 Oman
-
 Pakistan
-
 Palestine
-
 Panama
-
 Papua New Guinea
-
 Paraguay
-
 Peru
-
 Philippines
-
 Poland
-
 Portugal
-
 Puerto Rico
-
 Qatar
-
 Reunion
-
 Romania
-
 Rwanda
-
 Saudi Arabia
-
 Serbia
-
 Singapore
-
 Slovakia
-
 Slovenia
-
 Somalia
-
 South Africa
-
 Spain
-
 Sri Lanka
-
 Sweden
-
 Switzerland
-
 Syria
-
 Taiwan
-
 Tajikistan
-
 Tanzania
-
 Thailand
-
 Trinidad and Tobago
-
 Tunisia
-
 Turkey
-
 UAE
-
 Uganda
-
 Ukraine
-
 United Kingdom
-
United States
-
 Uruguay
-
 Uzbekistan
-
 Venezuela
-
 Vietnam
-
 Yemen
-
 Zambia
-
 Zimbabwe
- Forex
- Crypto












