

Intuit stock falls nearly 4% as 2027 guidance and sluggish growth weigh on sentiment

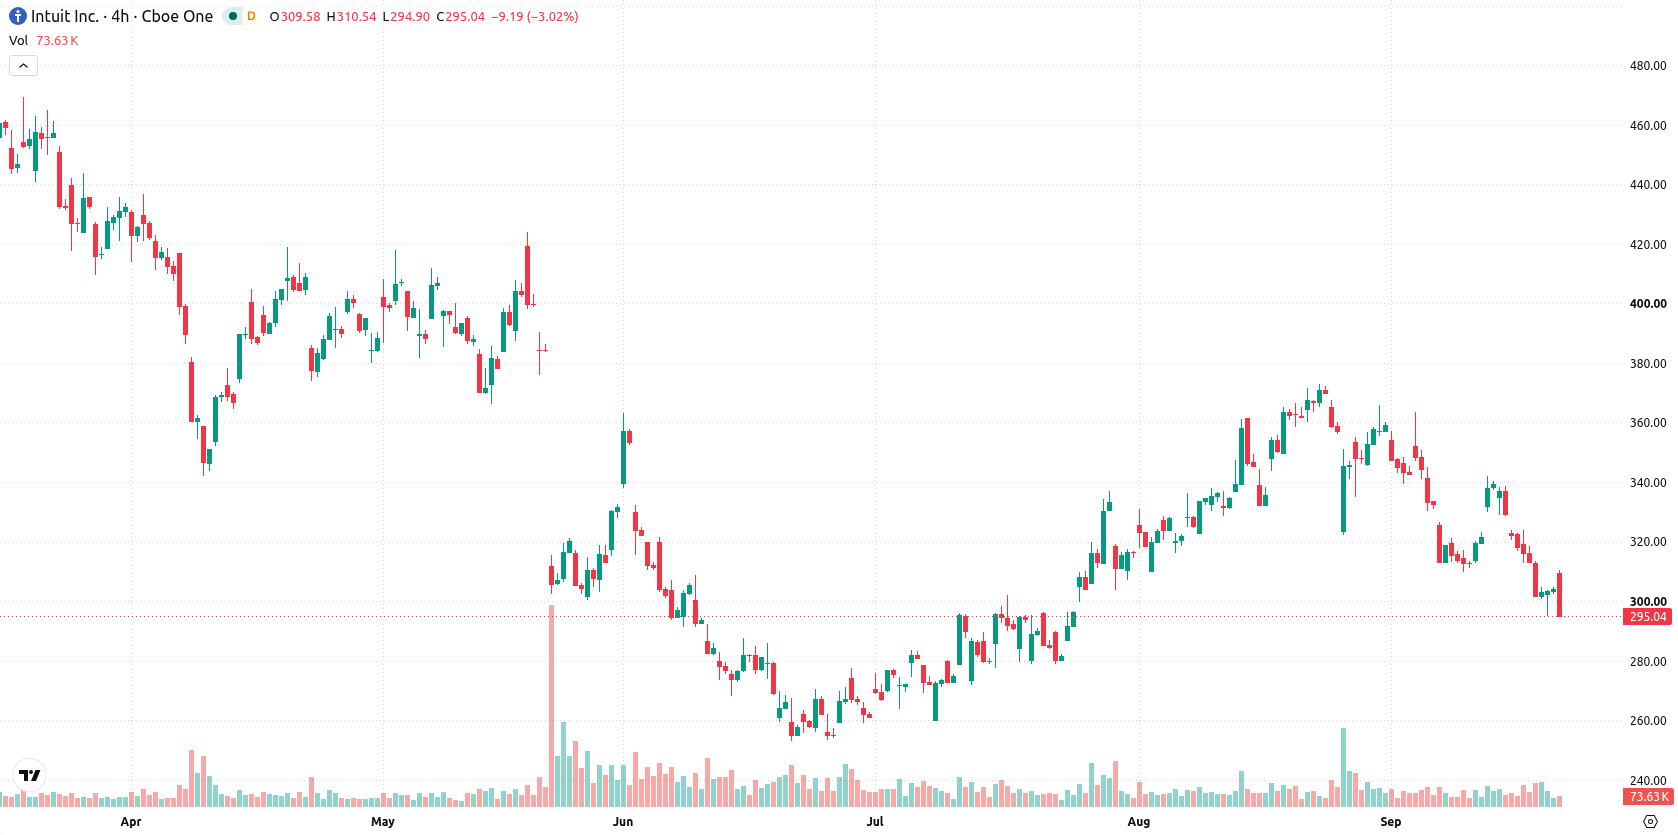
Intuit Inc. (INTU) fell 3.61% as sellers responded to renewed concerns around its reaffirmed 2027 guidance and slower-than-expected growth in key business segments. The decline is reinforced by the stock remaining below all its major moving averages, highlighting persistent downside momentum.
 356.50
Highlights
- Intuit reaffirmed fiscal 2027 revenue guidance at $23.28 billion to $23.51 billion, projecting 9 to 10 percent growth.
- Segments labeled Big Bets accounted for about 30 percent of 2026 revenue and exceeded 30 percent growth year over year.
- Shares of Intuit fell 3.61 percent to $293.16, with technical indicators showing strong seller control and a projected $278.86 to $307.47 trading range over the next week.
Shareholder returns offset by lingering selling after guidance reaffirmation
Intuit held its 2026 Investor Day and reaffirmed its fiscal 2027 revenue guidance at $23.28–$23.51 billion, with projected growth of 9–10%. The company also set guidance for Q1 2027 and FY 2027 EPS at 2.44–2.48 and 22.88–23.12, respectively. In fiscal 2026, the 'Big Bets' segments, including Assisted Tax, Money, and Mid-Market, made up about 30% of revenue and recorded year-over-year growth above 30%. Intuit also continued its shareholder return program with $5.5 billion in buybacks and $1.3 billion in dividends in fiscal 2026, though price action has remained under broader selling pressure.
Bearish momentum as price breaks support and oversold signals intensify
Intuit is trading below the 20-day ($333.82), 50-day ($324.91), and 200-day ($410.94) moving averages, reflecting sustained seller pressure in the short, medium, and long term. The nearest key levels are the near-term ceiling at $295.11 and the near-term floor at $278.86, with a bearish longer-term alignment between the 50-day and 200-day averages. Momentum readings remain firmly negative. The Moving Average Convergence Divergence (MACD) issues a sell signal, and the Average Directional Index (ADX) shows a lack of conviction with a neutral reading. Oversold conditions are confirmed by the Relative Strength Index (RSI) at 38.61 and sell direction, as well as strongly oversold Commodity Channel Index (CCI), Stochastic RSI, and Bull/Bear Power (BBP). BBP at -17.06 and forecast "Oversold" indicate sellers dominate intraday momentum. The Awesome Oscillator (AO) also aligns with prevailing downside pressure. The stock is trading at $293.16, falling $10.97 or 3.61% on the session following a downside gap of approximately 0.85%. Price action sits near the intraday low, with daily volatility at 3.29%. Intraday tone is distinctly negative, with momentum indicators confirming persistent seller control.
Previously it was reported that Intuit remained under sustained technical pressure despite reaffirming its long-term financial targets. The current analysis strengthens this bearish outlook with fresh indicator readings and highlights a key risk of renewed downside should support at $278.86 fail in the sessions ahead.










-
 Afghanistan
-
 Albania
-
 Algeria
-
 Angola
-
 Argentina
-
 Armenia
-
 Australia
-
 Austria
-
 Azerbaijan
-
 Bahamas
-
 Bahrain
-
 Bangladesh
-
 Belarus
-
 Belgium
-
 Bolivia
-
 Botswana
-
 Brazil
-
 Brunei
-
 Bulgaria
-
 Cambodia
-
 Cameroon
-
 Canada
-
 Chile
-
 China
-
 Colombia
-
 Congo
-
 Costa Rica
-
 Cote d'Ivoire
-
 Croatia
-
 Cuba
-
 Cyprus
-
 Czechia
-
 DR Congo
-
 Denmark
-
 Dominican Republic
-
 Ecuador
-
 Egypt
-
 El Salvador
-
 Estonia
-
 Eswatini
-
 Ethiopia
-
 Finland
-
 France
-
 Georgia
-
 Germany
-
 Ghana
-
 Greece
-
 Haiti
-
 Hong Kong
-
 Hungary
-
 India
-
 Indonesia
-
 Iran, Islamic republic
-
 Iraq
-
 Ireland
-
 Israel
-
 Italy
-
 Jamaica
-
 Japan
-
 Jordan
-
 Kazakhstan
-
 Kenya
-
 Korea
-
 Kuwait
-
 Kyrgyzstan
-
 Laos
-
 Latvia
-
 Lebanon
-
 Lesotho
-
 Libya
-
 Lithuania
-
 Luxembourg
-
 Madagascar
-
 Malaysia
-
 Malta
-
 Mauritius
-
 Mexico
-
 Moldova
-
 Mongolia
-
 Montenegro
-
 Morocco
-
 Mozambique
-
 Myanmar
-
 Namibia
-
 Nepal
-
 Netherlands
-
 New Zealand
-
 Nigeria
-
 North Macedonia
-
 Norway
-
 Oman
-
 Pakistan
-
 Palestine
-
 Panama
-
 Papua New Guinea
-
 Paraguay
-
 Peru
-
 Philippines
-
 Poland
-
 Portugal
-
 Puerto Rico
-
 Qatar
-
 Reunion
-
 Romania
-
 Rwanda
-
 Saudi Arabia
-
 Serbia
-
 Singapore
-
 Slovakia
-
 Slovenia
-
 Somalia
-
 South Africa
-
 Spain
-
 Sri Lanka
-
 Sweden
-
 Switzerland
-
 Syria
-
 Taiwan
-
 Tajikistan
-
 Tanzania
-
 Thailand
-
 Trinidad and Tobago
-
 Tunisia
-
 Turkey
-
 UAE
-
 Uganda
-
 Ukraine
-
 United Kingdom
-
United States
-
 Uruguay
-
 Uzbekistan
-
 Venezuela
-
 Vietnam
-
 Yemen
-
 Zambia
-
 Zimbabwe
- Forex
- Crypto












