

Intel shares technical analysis: $111.57 support test in focus

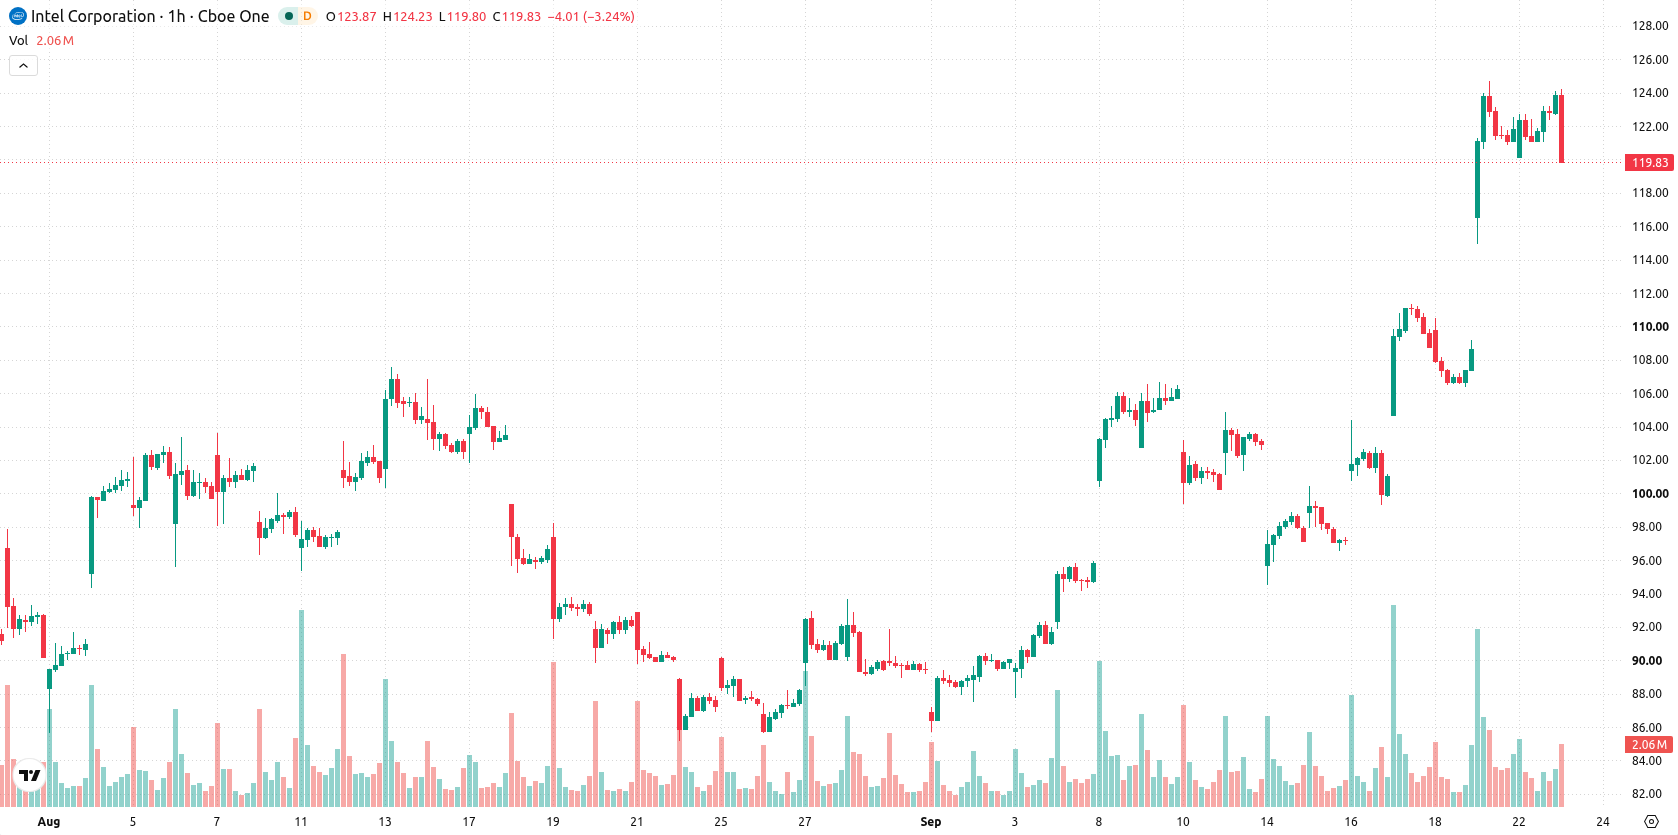
Intel (INTC) stock is trading at $120.04, down 3.08% on the day. The share price currently sits above its key moving averages, indicating continued bullish momentum across short and long timeframes.
 101.25
111.58
101.25
111.58
Highlights
- Intel reported Q2 2026 revenue of $16.1 billion, up 25% year over year across core business segments.
- The company raised about $20 billion from a share issuance to fund capital expenditures and working capital.
- Intel stock shows bullish technical momentum with an expected 2 to 3 day range of $111.57 to $128.51.
Capital raise and upbeat guidance buoy outlook amid selling pressure
Intel reported Q2 2026 revenue of $16.1 billion, reflecting a 25% year-over-year increase and confirming robust demand for its primary business segments, according to Coincentral. The company also issued Q3 revenue guidance in the range of $15.8 billion to $16.8 billion, providing updated insight into its near-term operating outlook. In August, Intel raised approximately $20 billion through a new share issuance, allocating the capital to ongoing capital expenditures and working capital initiatives, though price action has remained under broader selling pressure.
Overbought signals and strong momentum as support levels hold
Technical analysis shows INTC currently trading above its MA-20 at $117.68, MA-50 at $108.52, and MA-200 at $77.93. The Ichimoku Kijun at $115.57 offers immediate support, while $128.51 and $111.57 mark the next major resistance and support levels. MACD and ADX confirm strong momentum, with RSI at 74.17 and CCI both in overbought territory. Stochastic RSI and Awesome Oscillator remain neutral; Bull/Bear Power readings indicate intraday buyer dominance amid the high volatility.
Sideways action favored as volatility defines upside risk
Over the next two to three trading days, INTC is expected to consolidate within a volatility band between $111.57 and $128.51, with a 73% probability of an upward move. Should the price exceed $128.51, further gains may follow, while a drop below $111.57 would suggest a deeper near-term pullback. The baseline scenario favors sideways price action within this established corridor.
Earlier, analysts noted that while Intel’s strong performance was supported by rising AI-related demand and operational momentum, much of the optimism had already been priced in, increasing the risk of near-term profit-taking. The current technical setup—marked by persistent bullish momentum alongside overbought indicators—suggests traders should monitor the $111.57 support and $128.51 resistance closely for signs of either renewed breakout potential or the start of a corrective phase.





Latest Intel News




-
 Afghanistan
-
 Albania
-
 Algeria
-
 Angola
-
 Argentina
-
 Armenia
-
 Australia
-
 Austria
-
 Azerbaijan
-
 Bahamas
-
 Bahrain
-
 Bangladesh
-
 Belarus
-
 Belgium
-
 Bolivia
-
 Botswana
-
 Brazil
-
 Brunei
-
 Bulgaria
-
 Cambodia
-
 Cameroon
-
 Canada
-
 Chile
Chile
-
 China
China
-
 Colombia
-
 Congo
Congo
-
 Costa Rica
-
 Cote d'Ivoire
-
 Croatia
-
 Cuba
Cuba
-
 Cyprus
-
 Czechia
-
 DR Congo
-
 Denmark
-
 Dominican Republic
-
 Ecuador
-
 Egypt
Egypt
-
 El Salvador
-
 Estonia
-
 Eswatini
-
 Ethiopia
-
 Finland
-
 France
-
 Georgia
-
 Germany
-
 Ghana
Ghana
-
 Greece
-
 Haiti
Haiti
-
 Hong Kong
-
 Hungary
-
 India
India
-
 Indonesia
-
 Iran, Islamic republic
-
 Iraq
Iraq
-
 Ireland
-
 Israel
-
 Italy
Italy
-
 Jamaica
-
 Japan
Japan
-
 Jordan
-
 Kazakhstan
-
 Kenya
Kenya
-
 Korea
Korea
-
 Kuwait
-
 Kyrgyzstan
-
 Laos
Laos
-
 Latvia
-
 Lebanon
-
 Lesotho
-
 Libya
Libya
-
 Lithuania
-
 Luxembourg
-
 Madagascar
-
 Malaysia
-
 Malta
Malta
-
 Mauritius
-
 Mexico
-
 Moldova
-
 Mongolia
-
 Montenegro
-
 Morocco
-
 Mozambique
-
 Myanmar
-
 Namibia
-
 Nepal
Nepal
-
 Netherlands
-
 New Zealand
-
 Nigeria
-
 North Macedonia
-
 Norway
-
 Oman
Oman
-
 Pakistan
-
 Palestine
-
 Panama
-
 Papua New Guinea
-
 Paraguay
-
 Peru
Peru
-
 Philippines
-
 Poland
-
 Portugal
-
 Puerto Rico
-
 Qatar
Qatar
-
 Reunion
-
 Romania
-
 Rwanda
-
 Saudi Arabia
-
 Serbia
-
 Singapore
-
 Slovakia
-
 Slovenia
-
 Somalia
-
 South Africa
-
 Spain
Spain
-
 Sri Lanka
-
 Sweden
-
 Switzerland
-
 Syria
Syria
-
 Taiwan
-
 Tajikistan
-
 Tanzania
-
 Thailand
-
 Trinidad and Tobago
-
 Tunisia
-
 Turkey
-
 UAE
UAE
-
 Uganda
-
 Ukraine
-
 United Kingdom
-
United States
-
 Uruguay
-
 Uzbekistan
-
 Venezuela
-
 Vietnam
-
 Yemen
Yemen
-
 Zambia
-
 Zimbabwe
- Forex
- Crypto












