

Berkshire Hathaway stock consolidation continues as traders eye breakout from narrow technical band: weekly analysis

Shares of Berkshire Hathaway Inc. (BRK.B) are trading near $507 as the setup remains pressured and deep in oversold territory. The chart shows tightly contained movement and a clear disagreement between momentum signals, keeping direction uncertain. Traders will watch for resolution as sellers keep up the pressure heading into the week.
 556.20
547.05
Highlights
- Shares of Berkshire Hathaway traded slightly lower at $507.39 over the past week, remaining within a narrow range.
- Recent price action sits at both the 20-day and 50-day moving averages, indicating an indecisive trend in the immediate term.
- Technical indicators suggest oversold conditions with consolidation likely between $500.25 and $514.53 in the coming week.
Leadership changes and major deals accelerate strategic shift at Berkshire
In the past week, Warren Buffett stepped down as chairman of BRK.B, assuming the chairman emeritus role as Howard G. Buffett took over as chairman and Greg Abel now oversees daily operations, according to Yahoo Finance, Seeking Alpha, and Benzinga. Berkshire Hathaway resumed share buybacks, invested $10 billion in Alphabet, and completed the $6.8 billion acquisition of Taylor Morrison, reflecting expanded capital deployment under Greg Abel’s leadership. These leadership and investment actions mark a significant turning point for the company’s strategy in the week ahead.
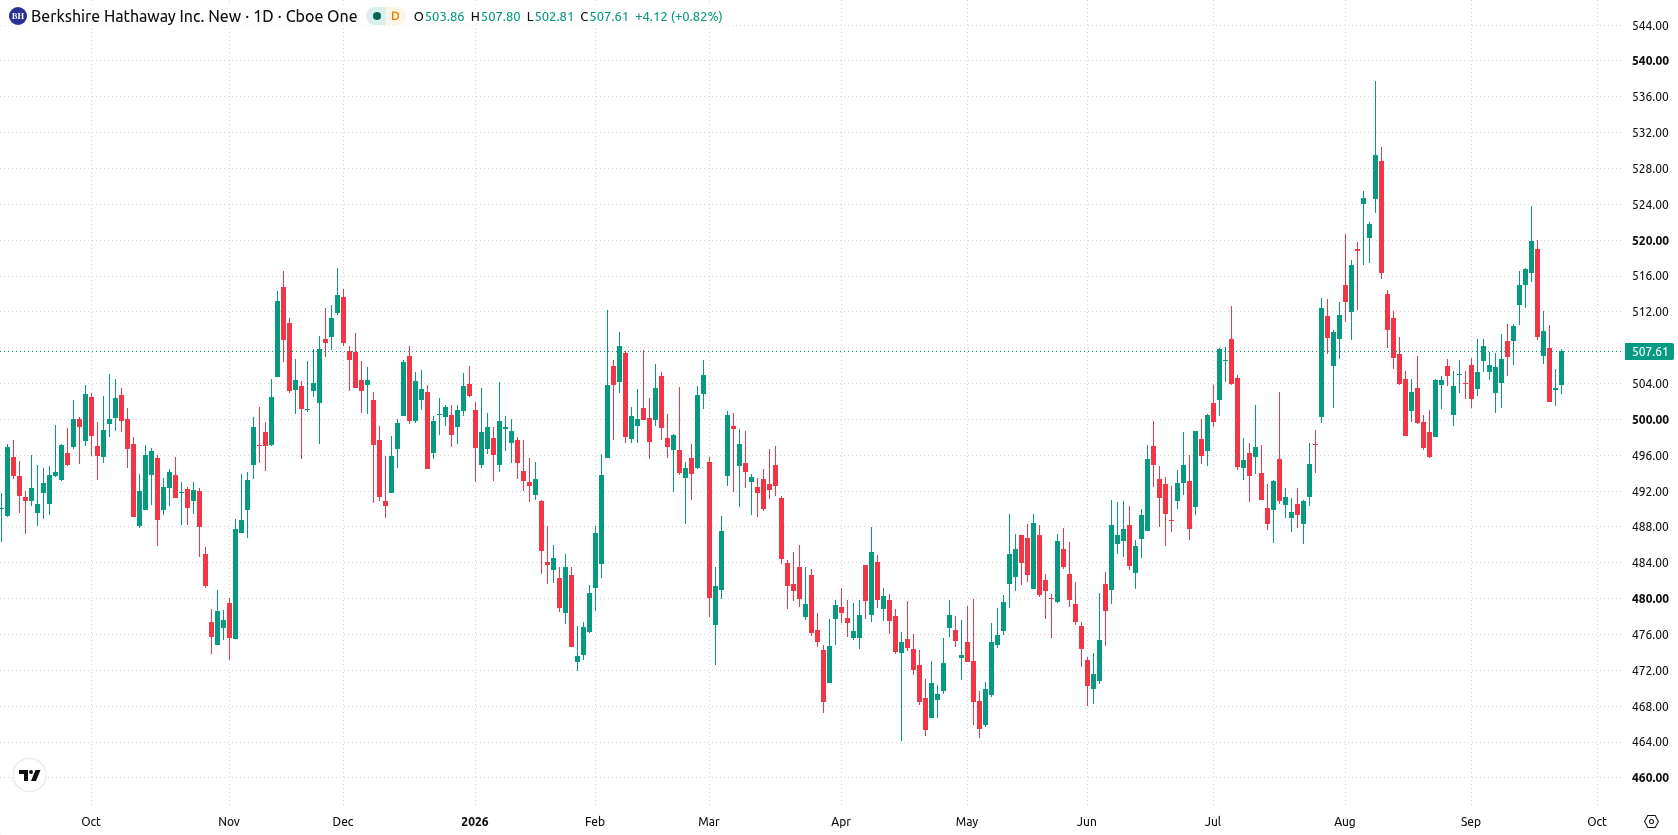
Narrow consolidation zone persists as technical signals diverge over the week
On the daily chart, the structure is flat, with the price pinned between the 50-day ($505.34) and 20-day ($507.42) moving averages, reflecting a contained move within a narrow range. Stochastic RSI is deep in oversold territory at 8.15, while the MACD maintains a strong buy direction, highlighting a divergence between momentum indicators. Volatility has been modest at 3.18% over the past week. Immediate support is at $505.34, with resistance at $507.42 and a further barrier at the Ichimoku Kijun level of $509.67.
Consolidation remains the base case barring breakout above resistance
For the coming trading week, the expected range is $500.25 to $514.53, with equal probabilities of a move higher or lower at 50% each. The base case is further consolidation within the identified range, bounded by $505.34 and $507.42. A close above resistance at $507.42 or a breakout past $509.67 would open a path toward the upper end at $514.53. A push below support at $505.34 could see shares test the lower boundary near $500.25.
Previously it was reported that Berkshire Hathaway deepened its exposure to the U.S. homebuilding sector, expanding its portfolio amid sector headwinds. With the company now undergoing major leadership changes and deploying significant capital in new investments, traders should monitor for shifts in price behavior as consolidation persists and critical levels near $505 remain in play.











-
 Afghanistan
-
 Albania
-
 Algeria
-
 Angola
-
 Argentina
-
 Armenia
-
 Australia
-
 Austria
-
 Azerbaijan
-
 Bahamas
-
 Bahrain
-
 Bangladesh
-
 Belarus
-
 Belgium
-
 Bolivia
-
 Botswana
-
 Brazil
-
 Brunei
-
 Bulgaria
-
 Cambodia
-
 Cameroon
-
 Canada
-
 Chile
-
 China
-
 Colombia
-
 Congo
-
 Costa Rica
-
 Cote d'Ivoire
-
 Croatia
-
 Cuba
-
 Cyprus
-
 Czechia
-
 DR Congo
-
 Denmark
-
 Dominican Republic
-
 Ecuador
-
 Egypt
-
 El Salvador
-
 Estonia
-
 Eswatini
-
 Ethiopia
-
 Finland
-
 France
-
 Georgia
-
 Germany
-
 Ghana
-
 Greece
-
 Haiti
-
 Hong Kong
-
 Hungary
-
 India
-
 Indonesia
-
 Iran, Islamic republic
-
 Iraq
-
 Ireland
-
 Israel
-
 Italy
-
 Jamaica
-
 Japan
-
 Jordan
-
 Kazakhstan
-
 Kenya
-
 Korea
-
 Kuwait
-
 Kyrgyzstan
-
 Laos
-
 Latvia
-
 Lebanon
-
 Lesotho
-
 Libya
-
 Lithuania
-
 Luxembourg
-
 Madagascar
-
 Malaysia
-
 Malta
-
 Mauritius
-
 Mexico
-
 Moldova
-
 Mongolia
-
 Montenegro
-
 Morocco
-
 Mozambique
-
 Myanmar
-
 Namibia
-
 Nepal
-
 Netherlands
-
 New Zealand
-
 Nigeria
-
 North Macedonia
-
 Norway
-
 Oman
-
 Pakistan
-
 Palestine
-
 Panama
-
 Papua New Guinea
-
 Paraguay
-
 Peru
-
 Philippines
-
 Poland
-
 Portugal
-
 Puerto Rico
-
 Qatar
-
 Reunion
-
 Romania
-
 Rwanda
-
 Saudi Arabia
-
 Serbia
-
 Singapore
-
 Slovakia
-
 Slovenia
-
 Somalia
-
 South Africa
-
 Spain
-
 Sri Lanka
-
 Sweden
-
 Switzerland
-
 Syria
-
 Taiwan
-
 Tajikistan
-
 Tanzania
-
 Thailand
-
 Trinidad and Tobago
-
 Tunisia
-
 Turkey
-
 UAE
-
 Uganda
-
 Ukraine
-
 United Kingdom
-
United States
-
 Uruguay
-
 Uzbekistan
-
 Venezuela
-
 Vietnam
-
 Yemen
-
 Zambia
-
 Zimbabwe
- Forex
- Crypto












