

What's behind JetBlue Airways's latest 3.6% stock pullback?

JetBlue Airways Corp (JBLU) fell 3.58% following an updated guidance that showed nonfuel unit costs and fuel expenses are expected to rise further in the upcoming quarter. The decline is supported by continued downside technical pressure, with the stock holding below all major moving averages.
 3.03
3.06
Highlights
- JetBlue Airways now expects both nonfuel unit costs and fuel costs per gallon to rise for the third quarter.
- Zacks Research updated its third-quarter 2026 earnings estimates for JetBlue following changes to operational and financial assumptions.
- Shares of JetBlue stock trade below key moving averages with ongoing downside momentum and a five-day forecast range of $4.18 to $4.58.
Cost guidance hike and earnings revisions reinforce bearish sentiment
JetBlue Airways revised its third-quarter cost outlook, with both nonfuel unit costs and fuel costs per gallon now projected to increase compared to prior expectations. Zacks Research updated its earnings estimates for JetBlue's financial performance in the third quarter of 2026. These corporate updates occurred as the company adjusted its operational and financial assumptions, though price action has remained under broader selling pressure.
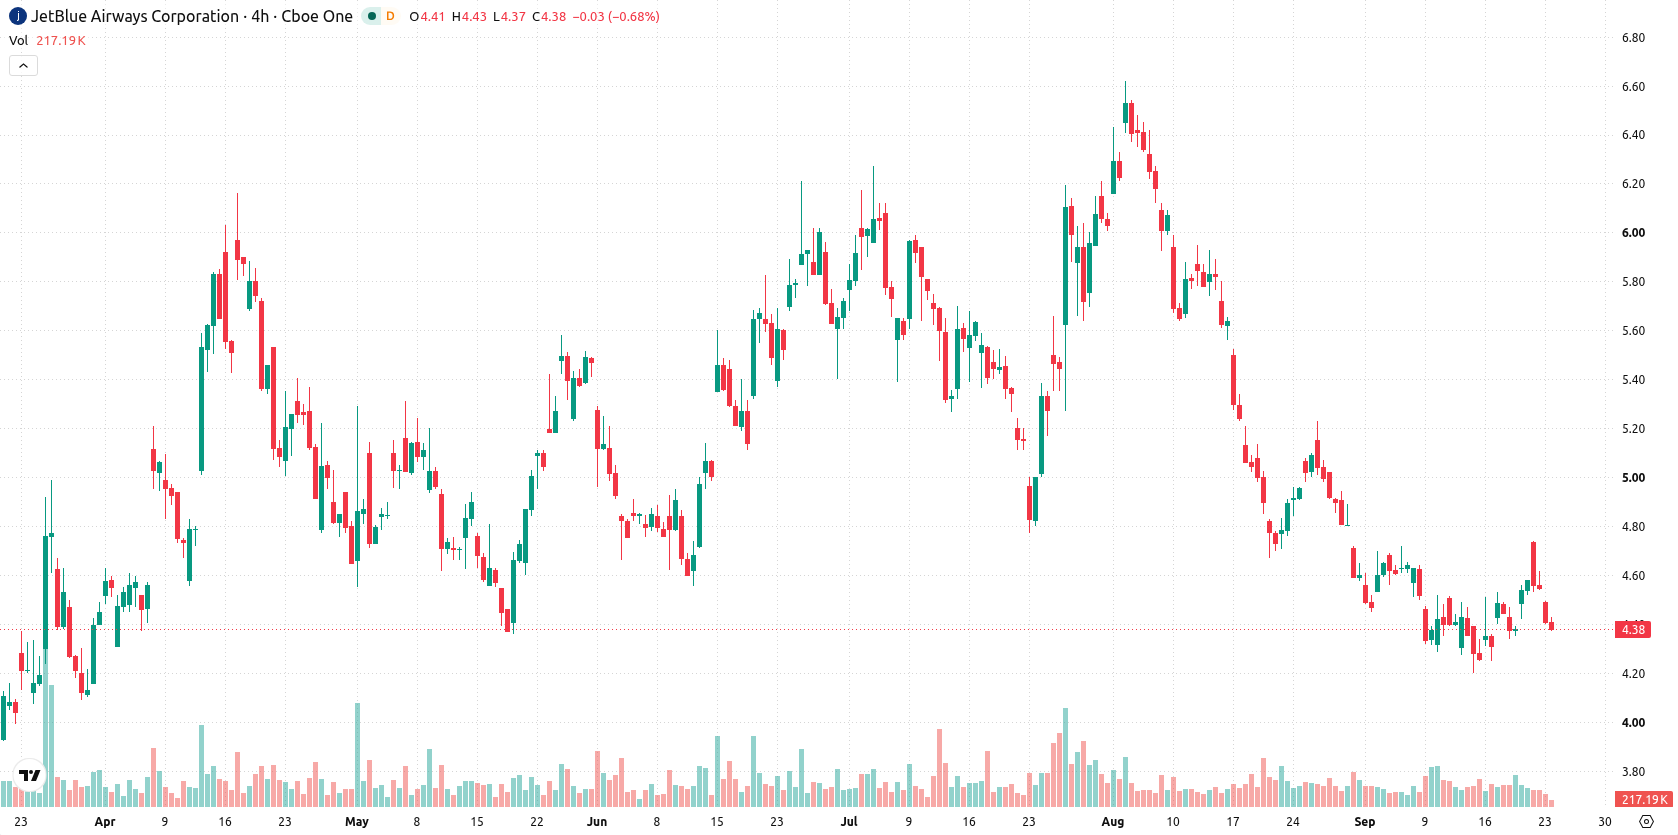
Downtrend persists as price struggles below technical barriers
JetBlue Airways is trading below its 20-day, 50-day, and 200-day moving averages ($4.57, $5.17, and $5.11), indicating persistent weakness across all timeframes. The nearest resistance stands at $4.40, with near-term support at $4.35, and a more distant resistance marked by the Ichimoku Kijun at $4.87. Momentum indicators remain negative, as the MACD issues a Strong Sell signal and the RSI sits at 43.95, pointing to a Sell bias. The Stochastic RSI is deep in overbought territory at 95.95, the ADX is Neutral, and the CCI is also Neutral. Bull/Bear Power signals intraday buyer presence, but overbought conditions suggest looming exhaustion. The market continues to experience steady selling pressure after the opening, and uneven signals across momentum and oscillator readings flag the potential for volatile and inconsistent trading action.
Earlier, analysts noted that JetBlue Airways faced persistent selling pressure and heightened downside risks, with technical signals pointing to consolidation rather than a near-term rebound. The current analysis reinforces this cautious stance, highlighting continued technical weakness and flagging $4.35 as a critical support level for traders to monitor over the coming sessions.









-
 Afghanistan
-
 Albania
-
 Algeria
-
 Angola
-
 Argentina
-
 Armenia
-
 Australia
-
 Austria
-
 Azerbaijan
-
 Bahamas
-
 Bahrain
-
 Bangladesh
-
 Belarus
-
 Belgium
-
 Bolivia
-
 Botswana
-
 Brazil
-
 Brunei
-
 Bulgaria
-
 Cambodia
-
 Cameroon
-
 Canada
-
 Chile
-
 China
-
 Colombia
-
 Congo
-
 Costa Rica
-
 Cote d'Ivoire
-
 Croatia
-
 Cuba
-
 Cyprus
-
 Czechia
-
 DR Congo
-
 Denmark
-
 Dominican Republic
-
 Ecuador
-
 Egypt
-
 El Salvador
-
 Estonia
-
 Eswatini
-
 Ethiopia
-
 Finland
-
 France
-
 Georgia
-
 Germany
-
 Ghana
-
 Greece
-
 Haiti
-
 Hong Kong
-
 Hungary
-
 India
-
 Indonesia
-
 Iran, Islamic republic
-
 Iraq
-
 Ireland
-
 Israel
-
 Italy
-
 Jamaica
-
 Japan
-
 Jordan
-
 Kazakhstan
-
 Kenya
-
 Korea
-
 Kuwait
-
 Kyrgyzstan
-
 Laos
-
 Latvia
-
 Lebanon
-
 Lesotho
-
 Libya
-
 Lithuania
-
 Luxembourg
-
 Madagascar
-
 Malaysia
-
 Malta
-
 Mauritius
-
 Mexico
-
 Moldova
-
 Mongolia
-
 Montenegro
-
 Morocco
-
 Mozambique
-
 Myanmar
-
 Namibia
-
 Nepal
-
 Netherlands
-
 New Zealand
-
 Nigeria
-
 North Macedonia
-
 Norway
-
 Oman
-
 Pakistan
-
 Palestine
-
 Panama
-
 Papua New Guinea
-
 Paraguay
-
 Peru
-
 Philippines
-
 Poland
-
 Portugal
-
 Puerto Rico
-
 Qatar
-
 Reunion
-
 Romania
-
 Rwanda
-
 Saudi Arabia
-
 Serbia
-
 Singapore
-
 Slovakia
-
 Slovenia
-
 Somalia
-
 South Africa
-
 Spain
-
 Sri Lanka
-
 Sweden
-
 Switzerland
-
 Syria
-
 Taiwan
-
 Tajikistan
-
 Tanzania
-
 Thailand
-
 Trinidad and Tobago
-
 Tunisia
-
 Turkey
-
 UAE
-
 Uganda
-
 Ukraine
-
 United Kingdom
-
United States
-
 Uruguay
-
 Uzbekistan
-
 Venezuela
-
 Vietnam
-
 Yemen
-
 Zambia
-
 Zimbabwe
- Forex
- Crypto












